Die kurze Antwort
FTIR material identification works by comparing the infrared absorption pattern of an unknown against reference spectra, and the identification is only as good as the sampling step that produced the spectrum. A mid-infrared spectrum runs from 4000 cm⁻¹ down to 400 cm⁻¹, and it divides into two halves that do different jobs: above about 1500 cm⁻¹ individual functional groups absorb at fairly predictable positions, while below 1500 cm⁻¹ the pattern belongs to the whole molecule and is what actually distinguishes one candidate from another 1. The workflow that works in practice is a sequence rather than a single measurement — choose a sampling mode that genuinely interrogates the material, check that the spectrum is good enough to search, assign the obvious bands, run a library search, and then treat the numerical match as a screening score and not as a conclusion 3. ASTM publishes the qualitative practice as E1252 [1], the spectrometer performance practice as E1421 2, and the guidance on curve-matching searches as E2310 [3].
What FTIR Material Identification Actually Depends On
The technique is often described as if the instrument produced the answer. It does not — it produces a spectrum, and the identification comes from what the analyst does with it.
| Bühne | Was geschieht | Where it usually goes wrong |
|---|---|---|
| Sampling | The material is brought into the beam in a way that gives a usable absorbance | Wrong mode for the sample: no optical contact, saturating thickness, or a coating measured instead of the substrate |
| Spectrum quality check | Noise, baseline, artefacts and resolution are checked before any search | A water vapour or CO₂ artefact is read as an analyte band |
| Band assignment | Obvious functional group bands are identified by position and shape | An overtone or an artefact is assigned as a functional group |
| Library search | The spectrum is compared against reference spectra by a curve-matching algorithm | An ATR spectrum is searched against a transmission library, or vice versa |
| Score interpretation | The match score is read as a screening number | The top hit is reported without any confirmatory check |
| Confirmation | The identification is checked against a reference measured the same way | Skipped, because the score looked high enough |
The point of laying it out this way is that failures cluster at the first and last stages. Most wrong identifications are not caused by a bad algorithm; they are caused by a spectrum that never represented the material, or by a correct score that was over-trusted.
What an Infrared Spectrum Tells You in FTIR Material Identification
| Region | Approximate range | What it is used for |
|---|---|---|
| Functional group region | 4000 – 1500 cm⁻¹ | Individual bonds absorb at fairly predictable positions; used to say what kinds of group are present |
| Fingerprint region | 1500 – 400 cm⁻¹ | The pattern belongs to the whole molecule; used to distinguish candidates that share the same groups |
That division explains why a search over the full range behaves differently from one over a single region. Two polymers can share every functional group and still be distinguishable, because their fingerprint patterns differ. Conversely, a spectrum that is noisy or distorted in the fingerprint region can still suggest a chemical class while being useless for a specific identification.
The Sampling Decision Comes First
ATR, the default for solids
For most FTIR material identification work, attenuated total reflection is the default for a reason: a solid or a liquid is pressed against a high-refractive-index crystal, the beam reflects internally, and the evanescent wave samples a few micrometres into the material. No pellets, no solvents, and a spectrum in under a minute. Two properties of the technique matter more than the convenience. It interrogates a surface, so a coating, a mould release layer or an oxidised skin is what gets measured rather than the bulk. And its effective pathlength varies with wavenumber, so band intensities in an ATR spectrum are not proportionally the same as in a transmission spectrum of the same material.
Übertragung, for pellets, films and liquids
Transmission remains the right answer in several specific cases. A fixed-pathlength cell has a known pathlength, which is what a quantitative calibration needs. It interrogates the whole thickness, so a dilute component in a bulk matrix is more likely to be seen. And it is directly comparable with the large body of published transmission reference data. The trade-offs are real: potassium bromide is hygroscopic and residual water introduces a broad O–H band that can be mistaken for the sample’s own, and a mineral-oil mull contributes its own C–H bands in exactly the region where many organic samples absorb.
Reflectance and microsampling
Specular and diffuse reflectance handle surfaces that cannot be pressed against a crystal, and an infrared microscope handles small particles, inclusions and multilayer films where the question is spatially resolved rather than bulk. These are the modes to reach for when the interesting part of the sample is a spot rather than the whole piece.
| Sampling-Modus | What it interrogates | Reach for it when |
|---|---|---|
| ATR | A few micrometres below a contacted surface | Routine solids, Filme, Flüssigkeiten, powders; fastest route to a searchable spectrum |
| Übertragung (Pellet, mull, film, cell) | The whole thickness | Quantitative work, dilute components, comparison with transmission reference data |
| Diffuse or specular reflectance | Surfaces that cannot be contacted | Beschichtungen, rough or curved parts, opaque surfaces |
| Microsampling | A spatially resolved spot | Particles, inclusions, multilayer films, contamination spots |
Checking the Spectrum Before You Search
Noise, baseline and resolution
A search run on a poor spectrum returns a poor answer, and the failure is quiet because the software always returns a top hit. Check three things. The baseline should be flat enough that peak heights are real rather than slope artefacts. The noise level should be low enough that weak fingerprint bands are distinguishable from noise, which usually means co-adding more scans rather than accepting the first result. And the resolution has to match the library: a spectrum recorded at a different resolution from the reference set will not match well even when the material is the same.
The artefacts that masquerade as bands
Atmospheric water vapour and carbon dioxide produce bands in every spectrum that is not properly purged or backgrounded, and both sit in regions where real absorptions also occur. Residual solvent, cleaning agent on an ATR crystal, and a previous sample are the other three classics. The discipline that catches all of them is simple: collect a background, run it, and look at it as a spectrum rather than dismissing it as a baseline.
Assigning the Obvious Bands
Band assignment is the step that turns a spectrum into a chemical hypothesis, and it is worth doing before the search rather than after it, because it gives you a way to reject a wrong hit.
| Approximate position | Common assignment | Notiz |
|---|---|---|
| 3200 – 3600 cm⁻¹ | O–H stretch | Broad when hydrogen-bonded; also where residual water appears |
| 3300 – 3500 cm⁻¹ | N–H stretch | Often sharper than O–H |
| 2850 – 2960 cm⁻¹ | C–H stretch | Present in nearly every organic material, so rarely diagnostic on its own |
| 2200 – 2260 cm⁻¹ | C≡N or C≡C | Uncluttered region, so a band here is informative |
| 1710 – 1740 cm⁻¹ | C=O stretch | Position shifts with the carbonyl type: esters sit higher, amides lower |
| 1600 Und 1500 cm⁻¹ | Aromatic ring | The pair is the signature rather than either band alone |
| 1240 cm⁻¹ region | C–O stretch | Strong in esters |
| 1000 – 1100 cm⁻¹ | C–O and Si–O | Si–O dominates in filled and mineral-loaded materials |
| 720 cm⁻¹ region | Long-chain CH₂ rocking | Indicates a chain of four or more methylene groups |
Treat the numbers as ranges rather than as identifiers, and verify any single assignment against a reference spectrum rather than a table. Publicly searchable collections such as the NIST Chemistry WebBook 5 and PubChem 6 are the practical way to check an individual compound, and reference materials from national metrology institutes are the way to check the instrument 4.
Library Search and What the Score Means
The search is the step everyone remembers and the one that decides least. FTIR material identification is settled by the sampling decision and the confirmation step, and the search sits between them.
How a search actually works
A library search compares the unknown with every reference spectrum in the set using a curve-matching algorithm and ranks the results, usually reporting a numerical match score — commonly called a hit quality index — for each candidate [3]. The score expresses how well the two curves agree over the range searched. It is a similarity measure, not a probability, and it is computed against whatever is in the library: a material that is not represented cannot be returned, and the best available hit may simply be the least poor match.
Why a good score can still be wrong
Three mechanisms produce confident-looking wrong answers. The first is a sampling-mode mismatch: an ATR spectrum searched against a transmission library is penalised by intensity differences that are instrumental rather than chemical, and the true material may not appear at the top. The second is a mixture: a two-component sample can match a third material better than either of its constituents. The third is a close analogue: homologues, copolymers with different ratios, and grades with different additive packages can all sit within a few points of each other, and the difference between them is often the entire point of the analysis.
The mitigations follow directly. Search like with like — ATR data against an ATR library, transmission data against a transmission library. Subtract a suspected component and re-search the residual, which is how mixtures are usually resolved. And treat the score as a threshold that decides whether to look closer, not as the answer. ASTM E2310 exists precisely because the search is a tool and the interpretation is the analyst’s job [3].
Confirming an Identification
The step that separates a library hit from an identification is measurement against a reference material on the same accessory, in the same sampling mode, under the same conditions. Where the result supports a specification, a regulatory submission or a dispute, this is not optional. Verification of the instrument itself belongs alongside it: wavelength and absorbance accuracy checked against a traceable standard reference material [4], and spectrometer performance described and measured to a documented practice such as ASTM E1421 [2].
Where FTIR Material Identification Stops
FTIR is very good at organic functional group chemistry and much less good at several other questions. It does not quantify trace components reliably in a strongly absorbing matrix. It struggles with aqueous samples, because water absorbs strongly across much of the mid-infrared. It says little about elemental composition, and nothing about metals or inorganic fillers beyond their anion bands. And it is a bulk or surface technique depending on the accessory, not a depth-resolved one.
For polymer work in particular, the question often moves from identification to verification and then to quantification, and that is a different workflow with different acceptance criteria — we set it out in FTIR polymer identification and QC workflows. If the real question is whether FTIR is the right technique at all, FTIR versus UV-Vis compares what each one actually measures, Und what an FTIR spectrometer is used for covers the wider application set.
Choosing an Instrument for FTIR Material Identification
The requirements for unknown identification are not exotic, but they are specific.
An ATR accessory that covers the materials you actually receive is the first consideration, and crystal choice follows the chemistry rather than the price list: diamond for hard or abrasive samples and for strong acids and bases, zinc selenide for routine organics within its pH window, germanium for high-refractive-index samples and very shallow sampling. We compare the three in ATR crystal selection: ZnSe versus diamond versus germanium.
A transmission and reflectance path is the second, because not every unknown can be contacted. Pellet presses, liquid cells and a diffuse or specular reflectance accessory convert the awkward samples into searchable spectra. Our FTIR spectrometer selection guide sets the two paths side by side.
Software that supports the workflow is the third, and it is the one most often bought badly. What matters is a searchable library supplied in the sampling mode you use, the ability to subtract and re-search a residual, and reporting that records the sampling mode and the score rather than only the winning name.
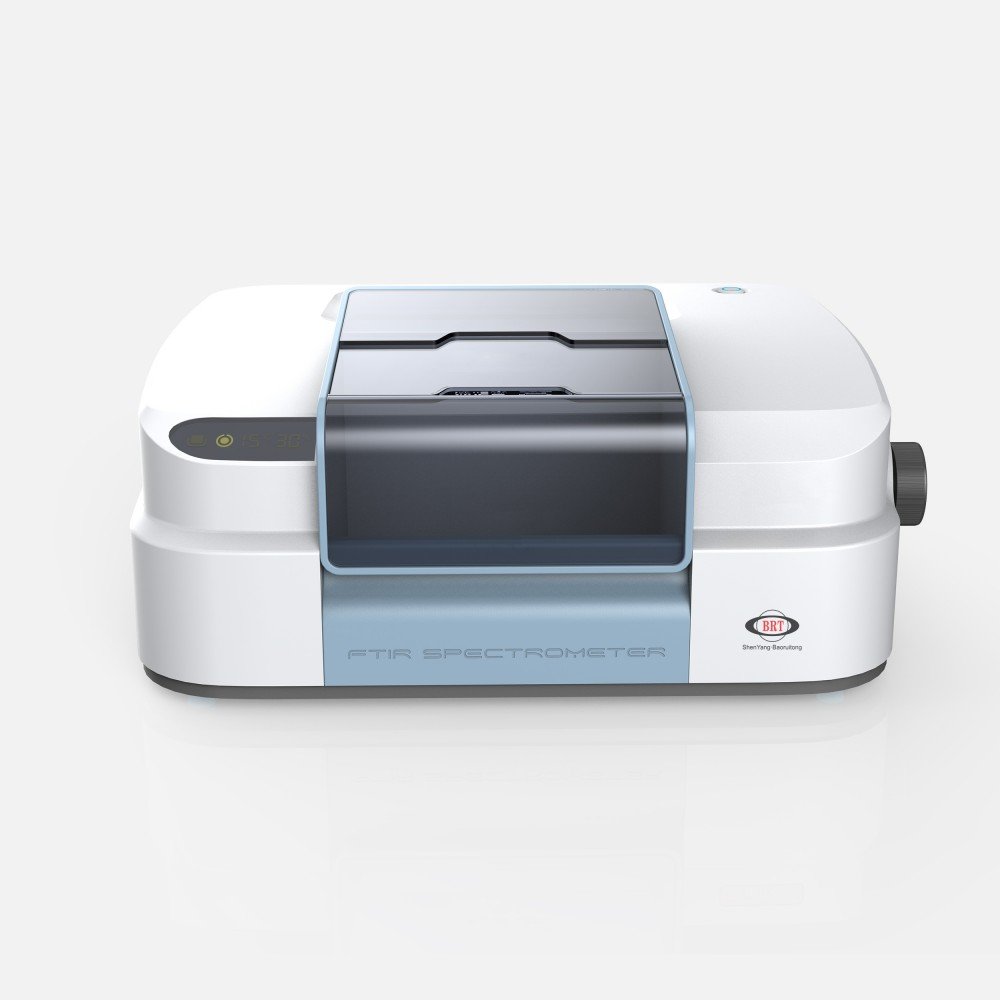
For most unknown work, Die BRT-8 Plus FTIR spectrometer covers the routine load; Die BRT-890 suits higher-throughput identification; und die BRT-850 is the compact option for incoming inspection next to the goods-in desk.
Mistakes in FTIR Material Identification
| Fehler | What it produces | What to do instead |
|---|---|---|
| Measuring a coating instead of the substrate | A correct spectrum of the wrong material | Cut, abrade or cross-section so the bulk is exposed |
| Searching ATR data against a transmission library | Depressed scores and wrong top hits | Match the sampling mode to the library |
| Accepting the top hit because the score looked high | A confident wrong answer, especially with mixtures | Subtract and re-search; confirm against a reference |
| Ignoring the background spectrum | Water vapour or CO₂ read as analyte bands | Look at the background as a spectrum |
| Recording too few scans | Fingerprint bands lost in noise | Co-add more scans before searching |
| Reporting a hit without the sampling mode | A result nobody can reproduce | Record the mode, the library and the score |
Häufig gestellte Fragen
Can FTIR identify any unknown material?
It identifies materials whose infrared absorption pattern is represented in a reference library and whose spectrum can be measured cleanly. It handles organic compounds and polymers well. It is weak on trace components in a strongly absorbing matrix, difficult with aqueous samples, and largely silent on metals and elemental composition.
What is a good hit quality score?
There is no universal threshold, because the score depends on the algorithm, the library and the sampling mode. Treat it as a screening number that decides whether to look closer, not as a conclusion. Set an internal threshold, record it, and always confirm an identification against a reference material measured the same way.
Why does an ATR spectrum not match a transmission library well?
Because the effective pathlength in ATR varies with wavenumber, so the relative band intensities differ from a transmission spectrum of the same material. The differences are instrumental rather than chemical, and a curve-matching algorithm reads them as chemical. Search ATR data against an ATR library.
How do I handle a sample that is clearly a mixture?
Measure it, search it, then subtract the best-matching component and re-search the residual spectrum. The residual is frequently a clean match to the second component. This is the standard way mixtures are resolved and it is why the software needs a subtraction function, not just a search.
Do I need to check the instrument as well as the sample?
Ja. An identification depends on the wavenumber and absorbance accuracy of the spectrometer. Verify against a traceable standard reference material and describe and measure performance to a documented practice such as ASTM E1421.
Is a KBr pellet better than ATR?
Neither is universally better. ATR is faster and needs no preparation, and is the right default for solids and liquids. Transmission through a pellet or a cell gives a known pathlength and interrogates the whole thickness, which is what quantitative work and dilute components need.
What should an identification report contain?
The sampling mode, the accessory and crystal, the number of co-added scans and the resolution, the library searched, the match score for the reported hit and for the next candidate, and a statement of whether the identification was confirmed against a reference material.
The Decision Sequence
- Decide what the sample physically is before choosing an accessory — solid, liquid, film, coating, powder or particle.
- Choose the sampling mode that interrogates that thing, not the one that is fastest.
- Collect a background and look at it. Most artefacts are caught here.
- Co-add enough scans that fingerprint bands are clearly above the noise.
- Assign the obvious bands before searching, so you can reject a wrong hit.
- Search like with like — ATR against ATR, transmission against transmission.
- Treat the score as a screen and confirm against a reference material measured the same way.
- Record mode, library and score in the report, or the result cannot be reproduced.
If you are configuring a laboratory for unknown work rather than buying a single instrument, contact the BRT application team with the material types and throughput you expect, and we will match the accessory set and library to them. For polymers specifically, FTIR analysis for polymers and plastics covers the material-side interpretation in more depth.
About the Author
This article was prepared by the BRT spectroscopy application team at Shenyang Baoruitong Automation Equipment Co., Ltd., which supplies FTIR spectrometers and ATR, transmission and reflectance accessories to quality control and materials laboratories. Method references are to ASTM International standard pages, and verification resources are the publicly accessible NIST reference data and standard reference material programmes.
Quellen
- ASTM International — E1252-98R21, general techniques for obtaining infrared spectra for qualitative analysis
- ASTM International — E1421-99R21, describing and measuring performance of Fourier transform mid-infrared spectrometers
- ASTM International — E2310-04, use of spectral searching by curve-matching algorithms with mid-infrared data
- NIST — Standard Reference Materials, for wavelength and photometric accuracy verification
- NIST Chemistry WebBook — publicly searchable infrared reference spectra
- PubChem (NCBI) — chemical identity and structure reference