- Die kurze Antwort
- The Methods That Actually Land on a UV-Vis Spectrophotometer for Food Analysis
- The Physics That Governs a Food Assay
- Building a Food Analysis Workflow
- Häufig gestellte Fragen
- Which food tests are actually performed by UV-Vis spectrophotometry?
- Why is a double-beam UV-Vis preferred for food samples?
- How is matrix interference handled in a spectrophotometric food assay?
- What should be verified before a food laboratory uses a new UV-Vis?
- Does temperature control matter for food analysis?
- How is a cuvette cleaned and checked in a food laboratory?
- Can one UV-Vis cover both tea polyphenols and nitrite in meat?
- Where Food Analysis Differs from Water Analysis
- Abschluss: Eine Entscheidungsanordnung
- Über den Autor
- Quellen
Die kurze Antwort
A UV-Vis spectrophotometer for food analysis earns its place by running the official spectrophotometric methods that the food standards actually prescribe — and most of those methods are older, narrower and more prescriptive than buyers expect. The clearest examples are the reference methods themselves: ISO 2918:1975 for the determination of nitrite content in meat and meat products 1, ISO 3091:1975 for nitrate content in the same matrix 2, ISO 3946:1982 for total phosphorus in starches and derived products by spectrophotometry 3, Und ISO 14502-1:2005 for total polyphenols in green and black tea by colorimetry using the Folin-Ciocalteu reagent 4. In the United States the equivalent authority is the AOAC Official Methods of Analysis, whose 22nd edition (2023) is the reference compendium for food chemistry methods 5. For a laboratory, the buying question is therefore not “which instrument is most sensitive” but “which methods must we run, at which wavelengths, with which reference materials, and can the instrument demonstrate wavelength accuracy and absorbance accuracy well enough to satisfy the method and the accreditation body?”
The Methods That Actually Land on a UV-Vis Spectrophotometer for Food Analysis
Reference Methods, Not Screening Tools
The food standards that matter for instrument selection are the ones written around spectrophotometry. Each of the four international standards below is a method in its own right, and each one states its own specimen preparation and its own measurement.
| Standard | Matrix and analyte | Method basis | Why it forces the instrument spec |
|---|---|---|---|
| ISO 2918:1975 [1] | Meat and meat products, nitrite content (Referenzmethode) | Hot-water extraction, protein precipitation, filtration, then colorimetric measurement | Absorbance read on a clarified extract — turbidity and matrix blank are the failure modes |
| ISO 3091:1975 [2] | Meat and meat products, nitrate content (Referenzmethode) | Reduction to nitrite followed by the same colorimetric read | Two-step chemistry, so wavelength accuracy and reagent blanking decide the result |
| ISO 3946:1982 [3] | Starches and derived products, total phosphorus | Destruction of organic matter by digestion with a sulpho-nitric mixture, then spectrophotometric determination | High-temperature digestion upstream of a precise absorbance read |
| ISO 14502-1:2005 [4] | Green and black tea, total polyphenols | Colorimetric assay using the Folin-Ciocalteu phenol reagent | Strongly absorbing, deeply coloured matrix — the hardest case for stray light and dilution accuracy |
Note what these have in common: none of them is a screening test. ISO 2918 is explicitly labelled a reference method [1], und ISO 3091 is the same [2]. A laboratory running a screening spectrophotometer against these methods inherits their traceability expectations whether or not the method text says so, because the accreditation system does.
Where AOAC Fits
Outside the ISO system, Die AOAC Official Methods of Analysis is the compendium that US food laboratories work to; the current edition is the 22nd, published in 2023 [5]. Many AOAC methods are AOAC-referenced methods for specific analytes that were historically determined spectrophotometrically. A supplier serving a US customer needs to be able to map each requested analyte to a method number and its edition, because a customer audit asks for the method reference on the certificate, not for the word “UV-Vis”.
The Instrument Questions Food Analysis Methods Ask
Each method asks the same three questions of the instrument, and a UV-Vis spectrophotometer for food analysis is judged on how it answers them.
| Instrument property | Why a food method cares | Typical consequence |
|---|---|---|
| Wellenlängengenauigkeit | Colorimetric endpoints are narrow-band | A wavelength error shifts the molar absorptivity and biases the result |
| Absorbance accuracy | Quantitation is built on a calibration curve | Linearity, not just range, decides the usable range |
| Streulicht | Beer-Lambert linearity breaks down at high absorbance | Dark, deeply coloured extracts are the worst case |
| Baseline noise | Small absorbance differences are the analyte signal | Photon noise at the detector sets the limit of detection |
| Cuvette and window material | Visible, UV and near-IR need different materials | Wrong cuvette absorbs at the measurement wavelength |
| Temperature control | Some assays are temperature-sensitive | Uncontrolled bench temperature becomes a bias |
The Physics That Governs a Food Assay
Beer-Lambert and Its Two Failure Modes
Every spectrophotometric food method rests on the Beer-Lambert relationship: absorbance is proportional to concentration for a given path length and wavelength. Two failures sit at either end of the usable range, and both appear constantly in food laboratories.
At the low end, stray light from the source and the detector leaks into the measured signal and inflates the absorbance, which flatters a low concentration result. At the high end, the detector no longer sees enough transmitted light, the response becomes non-linear, and the concentration calculated from the reading is too low. A deeply coloured tea extract or a strongly absorbing polyphenol assay hits the high end; a clear, dilute nitrite extract hits the low end. One instrument has to serve both without a second dilution step that introduces its own error.
Path Length and Dilution Accuracy
The path length of the cuvette multiplies the absorbance directly, and it is also the easiest parameter to get wrong in routine work: A 10 mm cell used where a 1 mm cell was intended doubles every reading, and a visibly dirty cell does the same thing in an unmeasured way. Food laboratories therefore treat the cuvette as a controlled consumable with a defined cleaning routine, not as a random piece of glassware.
Dilution is the second uncontrolled multiplier. Official methods specify the dilution with a defined volumetric procedure, and a laboratory that short-cuts it produces results that are internally consistent and externally wrong — which is worse than an obviously failed sample, because it passes internal quality control.
The Matrix Effect Is Where Food Fights Back
Food matrices carry colour, turbidity, emulsions and colloids that scatter light and absorb at the measurement wavelength. A spectrophotometric food assay therefore has to deal with three separate problems at once: the analyte absorbs, the matrix absorbs, and the matrix scatters. The standard responses are a matrix-matched blank, a sample treatment that clarifies the extract, and a correction for scattering where the method provides one.
| Matrix interference | What it does to the reading | Standard control |
|---|---|---|
| Intrinsic colour of the extract | Adds to the analyte absorbance | Reagent blank or matrix-matched blank |
| Turbidity and colloids | Scatters light, non-linearly | Clarification step, filtration, or the method’s prescribed extraction |
| Emulsion and suspended fat | Variable scattering, poor reproducibility | Homogenisation and defined settling time |
| Colourless interferent with its own absorbance | Adds a constant offset | Blank subtraction plus calibration over the working range |
| Instability of the analyte in the extract | Drift during the read | Read within the method’s stated time window |
Der how does a spectrophotometer measure absorbance article on this site sets out the optical chain in detail — light source, Monochromator, sample, detector and the conversion to absorbance — and is worth reading before choosing a configuration for a colour-heavy matrix.
Building a Food Analysis Workflow
Method First, Instrument Second
A defensible workflow starts from the method the customer will cite, not from the instrument in the catalogue.
- Collect the analyte-to-method map. For each requested analyte, record the standard or AOAC method number and edition, and the specific measurement it requires.
- Extract the operating conditions. Probenvorbereitung, wavelength, Pfadlänge, reagent blank, dilution range and the expected absorbance window.
- Check the absorbance window against the instrument. An expected absorbance near or above the upper linear limit forces a dilution step into the method — do that on paper first, not on the bench.
- Define the calibration approach. Curve-based or coefficient-based, and how many levels the method requires.
- Fix the QC regime. Verification wavelength, check standard, and the control chart that the accreditation body will ask to see.
Accreditation and Evidence
Two documents frame what a laboratory must be able to show. ISO/IEC 17025:2017 sets out the general requirements for the competence of testing and calibration laboratories 6 and is the reference for what a report has to demonstrate. ISO 22000:2018 sets the food safety management system requirements for any organization in the food chain 7 — the system-level framework that a food laboratory’s method validation, traceability and record keeping sit inside.
For method validation itself, the Eurachem guide Fitness for Purpose of Analytical Methods is the practical reference most laboratories work from 8. Its core argument is the one that matters in a food laboratory: the validation parameters should be matched to how the method will actually be used — expected concentration range, required precision, and the acceptable measurement uncertainty for the decision the result feeds.
Verifying the Instrument for Food Work
Verification is what turns a delivery into a working instrument. For spectrophotometry the standard instrument is a certified holmium oxide solution, published by NIST as SRM 2034; the certificate covers certified wavelength positions from about 240 nm zu 650 nm, and it is the reference used to confirm wavelength accuracy after installation, after a lamp change and at defined intervals in between 9.
| Verification step | Referenzmaterial | What it demonstrates |
|---|---|---|
| Wellenlängengenauigkeit | NIST SRM 2034 holmium oxide solution [9] | The instrument reads the certified wavelengths |
| Absorbance accuracy | Certified absorbance reference material | The reported absorbance is traceable |
| Stray light check | Suitable secondary filter or cutoff test | High-absorbance readings are not inflated |
| Linearity check | Series of known concentrations | Response is proportional over the working range |
| Wiederholbarkeit | Single standard, repeated reads | Precision on the bench is adequate |
Der UV-Vis spectrophotometer calibration article covers how these checks are scheduled and documented, und die wavelength accuracy and stray light verification article goes deeper on the two parameters that decide whether a food method is defensible.
Choosing the Configuration
The choice follows from the method list rather than from a feature list.
| Requirement from the method list | Configuration implication |
|---|---|
| Assays in the UV range below 400 nm | Quartz or fused-silica cuvettes and a UV-capable source |
| Deeply coloured extracts at high absorbance | Double-beam optics and a stray-light spec stated in absorbance units |
| Low-level nitrite-type reads near the detection limit | Low stray light, good photon-level noise, long integration or dual-beam referencing |
| Many samples per day | Autosampler, cuvette handling, and plate or cuvette throughput |
| Results reported for regulated clients | Traceable calibration and an exportable data path |
| Multiple methods on one instrument | Wavelength accuracy across the whole working range, verified with SRM 2034 [9] |
The related articles on this site complete the picture: Die UV-Vis buying guide covers single-beam versus double-beam selection, Und UV-Vis spectrophotometer applications in quality control places the same instrument in a broader QC workflow.
Häufig gestellte Fragen
Which food tests are actually performed by UV-Vis spectrophotometry?
The official spectrophotometric methods cover nitrite in meat and meat products (ISO 2918, a reference method), nitrate in the same matrix (ISO 3091), total phosphorus in starches and derived products (ISO 3946), and total polyphenols in green and black tea (ISO 14502-1). In the US the AOAC Official Methods of Analysis, 22nd edition (2023), is the reference compendium for food chemistry methods. Each is a defined procedure with its own preparation, wavelength and reporting requirements.
Why is a double-beam UV-Vis preferred for food samples?
Because food extracts are strongly absorbing and deeply coloured, which is where stray light and source drift distort a reading most. Double-beam referencing splits the beam so that the sample and a reference are measured simultaneously, which stabilises the ratio at high absorbance and makes the dark, coloured extract cases more reliable than a single-beam design can manage.
How is matrix interference handled in a spectrophotometric food assay?
With a blank that accounts for the matrix, a clarification step that removes scattering particles, and calibration across the working range rather than at a single point. ISO 2918 uses hot-water extraction with protein precipitation and filtration, und ISO 14502-1 works with a strongly coloured tea extract — in both cases the matrix is part of the method, so the blank and the calibration have to match it.
What should be verified before a food laboratory uses a new UV-Vis?
Wavelength accuracy first, using a certified reference material such as NIST SRM 2034, whose certificate covers certified wavelength positions from roughly 240 nm zu 650 nm. Then absorbance accuracy against a certified reference, a stray-light check, a linearity check across the working range, and repeatability on a single standard. ISO/IEC 17025:2017 und ISO 22000:2018 then frame how the results must be documented and controlled.
Does temperature control matter for food analysis?
It does for any assay whose chemistry is temperature-sensitive, and it matters for reproducibility in general, because the same extract read warm and cold does not return the same absorbance. Bench instruments without temperature control are workable only where the method states a read temperature and the laboratory documents that it was held.
How is a cuvette cleaned and checked in a food laboratory?
Cuvettes are a controlled consumable, not glassware of convenience. Food extracts leave films that raise absorbance at exactly the wavelength being measured, so cleaning has a defined routine and a defined acceptance check — usually a blank reading on the same cuvette used for the sample. Path length is the second control: because absorbance scales directly with cell length, a laboratory fixes the cell length used for each method, records it on the worksheet, and replaces cells that have been scratched or etched by alkaline digestion. Both controls exist because a contaminated or mismatched cell produces a consistent, plausible, wrong number rather than an obvious failure.
Can one UV-Vis cover both tea polyphenols and nitrite in meat?
Ja, and that combination is a useful buying case because the two assays sit at opposite ends of the absorbance range: tea polyphenols are dark and strongly absorbing, nitrite extracts are pale and dilute. The instrument has to be linear and stray-light-free at the low end and stable at the high end, which is a specification question for the vendor rather than a capability question for the method.
Where Food Analysis Differs from Water Analysis
The comparison with the best-known UV-Vis application is instructive. A drinking-water laboratory typically runs one dominant assay — the UV absorbance at 254 nm for organic content — on clear, low-concentration samples whose main challenge is stray light and baseline stability. A food laboratory runs a portfolio of methods across different matrices, each with its own extraction chemistry, its own wavelength and its own interference profile [1][2][3][4]. That difference changes the buying logic in two ways.
Erste, the instrument has to be flexible in optics and cuvettes rather than optimised for a single window: UV below 400 nm for some assays, visible for colorimetric endpoints, and quartz or fused silica where the method requires them. Zweite, the throughput pattern differs. Water laboratories prioritise sensitivity at low absorbance and can automate a single method; food laboratories prioritise switching between methods with minimal operator intervention, because the batch contains many different samples rather than many replicates of one sample.
| Dimension | Drinking-water application | Food analysis application |
|---|---|---|
| Method portfolio | One dominant assay at 254 nm | Multiple analytes, each with its own method [1][2][3][4] |
| Sample state | Clear, low concentration | Turbid, coloured, colloidal [1][4] |
| Dominant error source | Stray light at low absorbance | Matrix absorption and scattering |
| Extraction chemistry | Minimal | Method-specific: hot-water extraction, sulpho-nitric digestion, colorimetric reagents |
| Umgang mit Küvetten | Disposable, standard 10 mm | Defined cleaning, recorded path length, cell-specific blanks |
| Batch pattern | Many replicates of one matrix | Many different matrices in one run |
| Instrument priority | Sensitivity and baseline stability | Optical range, cuvette flexibility, method switching |
Abschluss: Eine Entscheidungsanordnung
- Start from the method list, not the instrument list: ISO 2918, ISO 3091, ISO 3946, ISO 14502-1 and the AOAC methods the customer will cite [1][2][3][4][5].
- Extract the wavelength, Pfadlänge, blank and dilution requirements from each method.
- Check the expected absorbance window against the instrument’s stated linear range and stray-light specification before committing.
- Plan the verification chain: NIST SRM 2034 for wavelength, certified absorbance material, linearity and repeatability [9].
- Put the method validation and reporting regime in place against ISO/IEC 17025 und ISO 22000 [6][7], using the Eurachem fitness-for-purpose guidance to match validation depth to use [8].
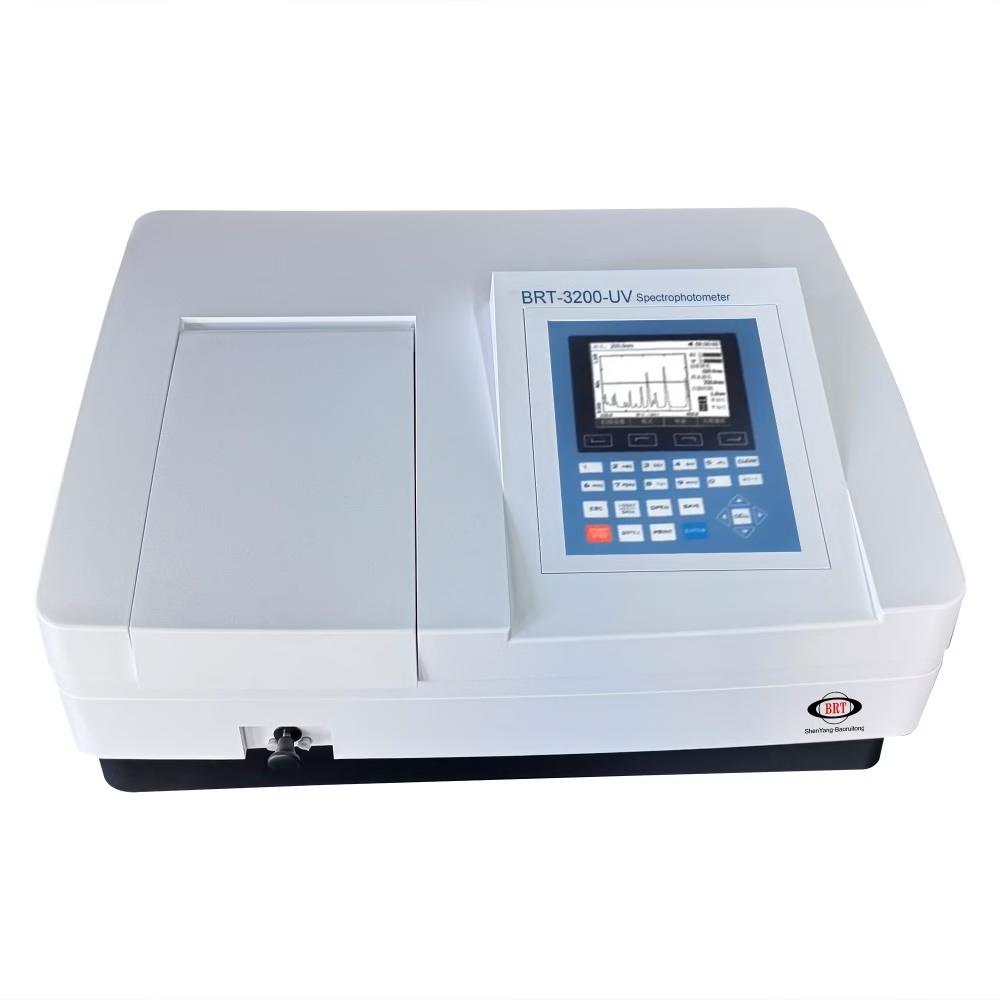
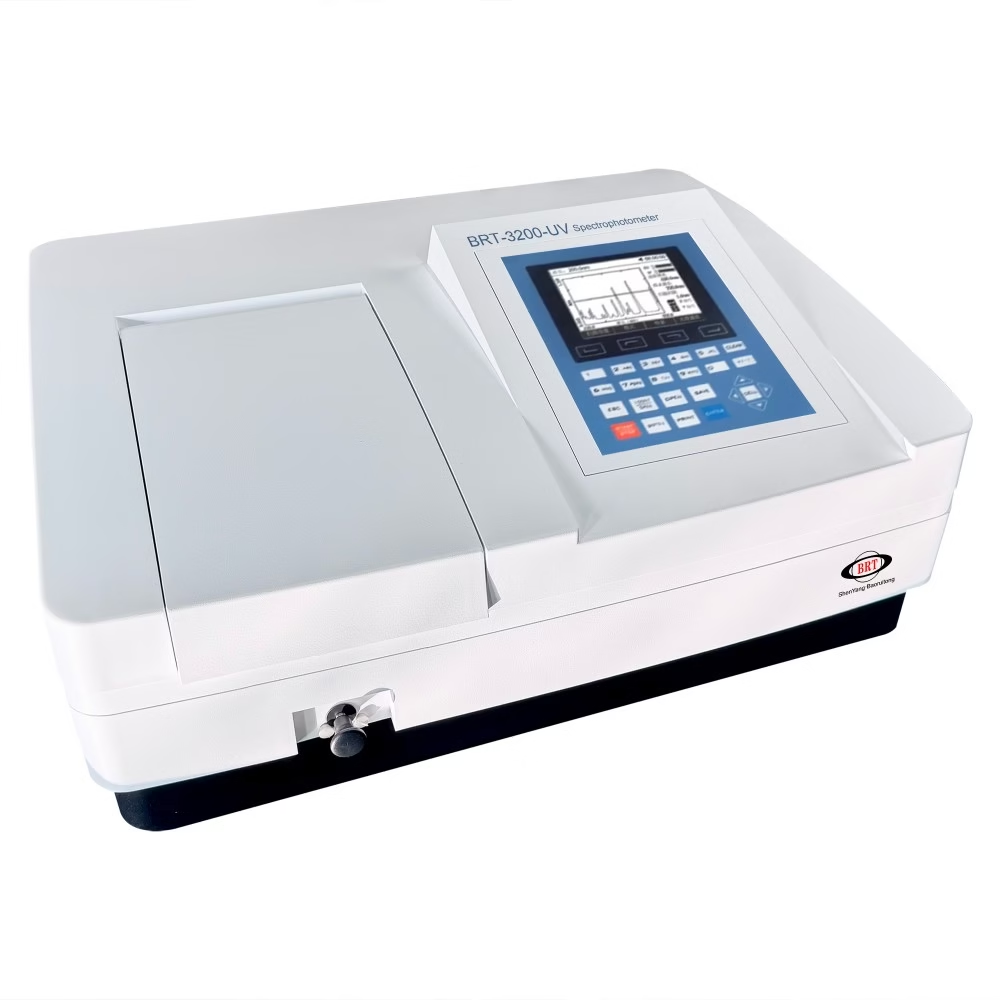
Run this order once per laboratory and a UV-Vis spectrophotometer for food analysis stops being a general-purpose instrument and becomes a validated measurement system: each analyte tied to a method, each method tied to operating conditions, and each instrument tied to a verification record that survives an audit. For the instrument side, Die BRT-3200UV Und BRT-5200UV pages cover the configurations; send BRT your analyte-to-method list and the absorbance range you work in, and we will map the configuration, cuvette materials and verification package.
Über den Autor
BRT-Tests (Shenyang Baoruitong Automation Equipment) manufactures UV-Vis and visible spectrophotometers — single and double beam instruments in the BRT-1100UV to BRT-6100UV range — for food, pharmaceutical, environmental and polymer laboratories. The content team writes for laboratory buyers and QC managers, with the standards cited above verified against the UNI catalogue, the AOAC official methods page and NIST reference material certificates in November 2026.
Quellen
- SCHLAF – GROSS 2918:1975, Meat and meat products — Determination of nitrite content (Reference method). https://webstore.uni.com/en/iso-2918-1975
- SCHLAF – GROSS 3091:1975, Meat and meat products — Determination of nitrate content (Reference method). https://webstore.uni.com/en/iso-3091-1975
- SCHLAF – GROSS 3946:1982, Starches and derived products — Determination of total phosphorus content — Spectrophotometric method. https://webstore.uni.com/en/iso-3946-1982
- SCHLAF – GROSS 14502-1:2005, Determination of substances characteristic of green and black tea — Part 1: Content of total polyphenols in tea — Colorimetric method using Folin-Ciocalteu reagent. https://webstore.uni.com/en/iso-14502-1-2005
- AOAC INTERNATIONAL — Official Methods of Analysis of AOAC INTERNATIONAL, 22nd Edition (2023). https://www.aoac.org/official-methods-of-analysis/
- UNI — ISO/IEC 17025:2017, General requirements for the competence of testing and calibration laboratories (in force 29 November 2017). https://webstore.uni.com/en/iso-iec-17025-2017
- SCHLAF – GROSS 22000:2018, Food safety management systems — Requirements for any organization in the food chain (in force 18 Juni 2018). https://webstore.uni.com/en/iso-22000-2018
- Eurachem — Eurachem Guides, including Fitness for Purpose of Analytical Methods: A Laboratory Guide to Method Validation and Related Topics. https://www.eurachem.org/index.php/publications/guides
- NIST — Certificate of Analysis, SRM 2034 (Holmium oxide solution for wavelength accuracy verification of UV-Vis spectrophotometers). https://tsapps.nist.gov/srmext/certificates/2034.pdf