- La respuesta corta
- What a Research Lab Asks a Spectrometer to Do
- Resolution and Signal-to-Noise: One Budget, Two Claims
- Rango espectral: Where the Answer Often Sits Outside 4000–400
- Sampling Modes a Research Programme Actually Needs
- Wavenumber Accuracy and the Calibration Chain
- Time-Resolved Work: Kinetics and Hyphenation
- Data, Libraries and Search
- A Capability Matrix by Research Type
- What to Specify in a Tender
- Hidden Costs in a Research FTIR
- Equipment
- Preguntas frecuentes
- What resolution does a research FTIR spectrometer need?
- Is 4000 a 400 cm⁻¹ enough for materials research?
- What does NIST SRM 1921b certify?
- Why is signal-to-noise quoted at a specific resolution?
- Can a portable FTIR replace a bench instrument in a research lab?
- How much does an FTIR spectrometer for research cost?
- Which standard should a tender cite for performance?
- Conclusión: A Decision Order
- About the Author
- Fuentes
La respuesta corta
A research laboratory needs an FTIR spectrometer to answer questions that were not defined when the instrument was bought, so the specification has to be written around capability rather than around a single application. A quality-control bench measures the same product against the same library every day, and a fixed configuration serves it well. A research programme moves between polymer identification, surface chemistry, decomposition products, kinetics and trace contaminants inside a single month, and each of those asks something different of resolution, spectral range, sampling accessory and scan speed. The practical way to specify is to fix four things — the wavenumber range you must cover, the resolution your narrowest feature needs, the sampling modes your samples demand, and the scan budget for time-resolved work — and then buy the instrument that covers all four with margin.
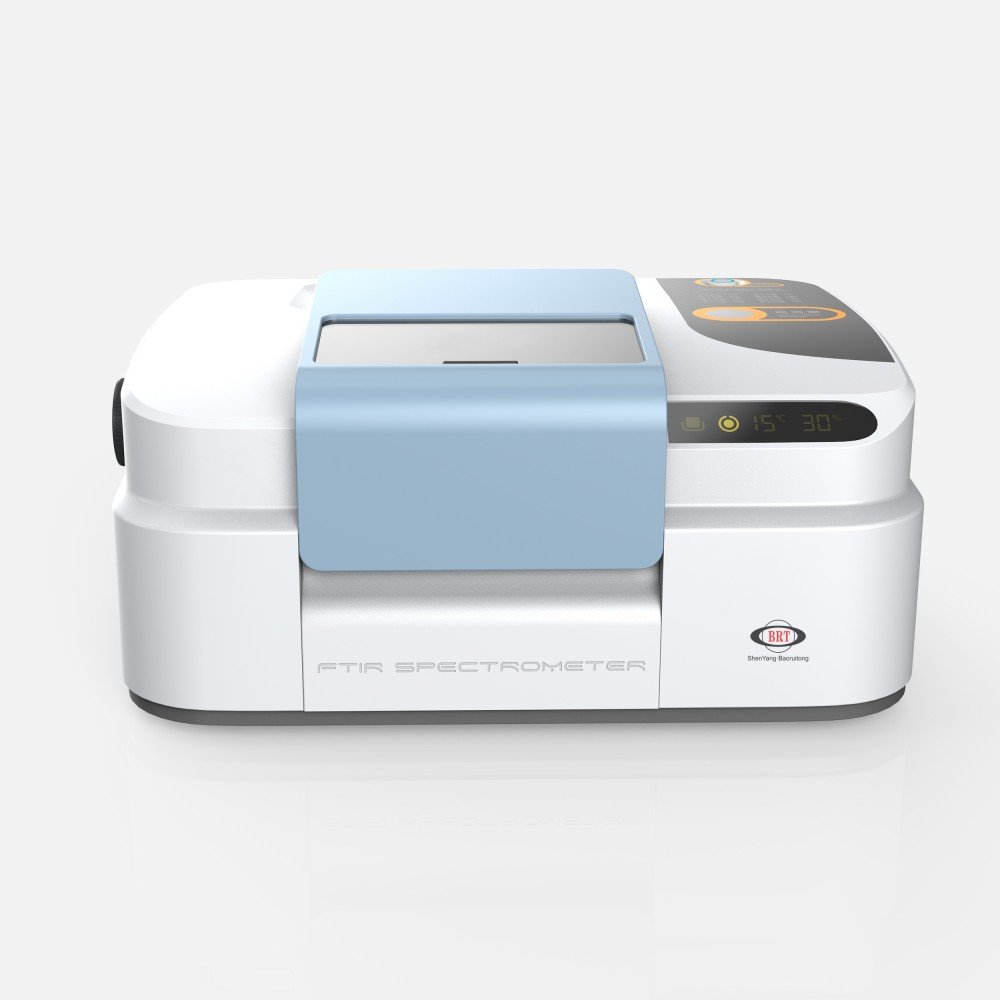
What a Research Lab Asks a Spectrometer to Do
The difference between a QC bench and a research bench is not sample volume. It is the number of distinct questions the instrument has to survive.
Five capability axes
Every requirement a research group writes reduces to one of five axes: wavenumber range, resolution, signal-to-noise at that resolution, sampling geometry, y time resolution. Instruments are sold on the first two because they are easy to print on a datasheet; the last three decide whether the instrument is still useful in year three.
Where a QC bench stops
A QC method is fixed: same accessory, same resolution, same library, same acceptance window. That is a strength, not a limitation, and it is why a compact instrument with one ATR accessory is the right purchase for a production laboratory. The failure mode in research is different — the method changes, and an instrument that cannot change with it becomes a dedicated polymer identifier sitting next to a queue of samples it cannot touch.
Resolution and Signal-to-Noise: One Budget, Two Claims
Resolution and signal-to-noise are usually presented as independent selling points. They are not. They are two ends of the same measurement budget.
What resolution is actually for
Resolution decides whether two features close together can be seen as two features. For polymer identification at 4 cm⁻¹ the answer is almost always yes, because the bands of interest are broad. For gas-phase work, rotational fine structure and overlapping small-molecule bands can be lost entirely at 4 cm⁻¹ and recovered at 1 cm⁻¹ or better. Buying 0.5 cm⁻¹ for a polymer programme spends money on a capability that will not be used; buying 4 cm⁻¹ for an emissions programme makes the method impossible.
The scan budget
Signal-to-noise improves with the square root of the number of co-added scans, and a narrower resolution element delivers less energy per scan, so high resolution and high signal-to-noise are bought from the same budget. In practice this means a specification that says “0.5 cm⁻¹ resolución” without a signal-to-noise figure at that resolution is describing a scan that takes a long time and may still be noisy. ASTM E1421 exists precisely to describe and measure FT-MIR performance in a way that can be compared between instruments 1, and it is the reference to cite in a tender.
| Requirement | Typical setting | Consequence if you get it wrong |
|---|---|---|
| Polymer identification and comparison | 4 centímetros⁻¹ | Higher resolution adds scan time, not information |
| Additive or contaminant trace work | 2 a 4 cm⁻¹ with high scans | Too few scans buries the minor component in noise |
| Gas-phase or small-molecule speciation | 1 cm⁻¹ or better | Fine structure is lost and libraries will not match |
| Rapid kinetics | Low resolution, few scans | High resolution cannot keep up with the reaction |
Rango espectral: Where the Answer Often Sits Outside 4000–400
The standard mid-infrared window runs from 4000 a 400 centímetros⁻¹, and most routine spectra live comfortably inside it. Research samples frequently do not.
Below 400 centímetros⁻¹
Inorganic fillers, mineral phases, metal oxides and some lattice vibrations absorb below 400 centímetros⁻¹, in the region usually described as far-infrared. Reaching it is not a software option: it requires a different beamsplitter, a different window material and a detector that responds there. A spectrometer sold as “4000 to 400” cannot be extended by buying an accessory.
Above 4000 centímetros⁻¹
Near-infrared work — overtones and combination bands, moisture and hydroxyl determination, process monitoring — sits above the mid-infrared window, typically using different source and detector combinations. A research group that intends to move between mid-IR identification and NIR quantification should decide that at purchase, because retrofitting a second optical path is rarely economic.
The conversion between the two conventions is worth keeping in mind when reading certificates: wavenumber in cm⁻¹ is 10⁴ divided by wavelength in micrometres. A certified band at 18.3512 µm is 544.92 centímetros⁻¹, and the arithmetic is the check that the certificate is being read correctly 6.
Sampling Modes a Research Programme Actually Needs
Accessories are where research capability is actually bought, and the list is longer than most tender documents admit.
| Mode | What it handles | What it cannot do | Research use |
|---|---|---|---|
| ATR | Solids, pastes, liquidos, thick films, no preparation | Very thin films, and depth profiling | Default mode for polymers, coatings and unknowns |
| Transmission | Thin films, KBr pellets, mulls, liquids in cells | Thick or opaque samples | Quantitative work and library-quality spectra |
| Specular reflection | Films on reflective substrates | Rough surfaces | Coating thickness and surface chemistry |
| Diffuse reflection (DRIFTS) | Powders, catalysts, rough solids | Strongly absorbing dark samples | Catalysis and mineral powders |
| Micro-sampling | Single fibres, inclusions, contaminants | Bulk heterogeneity | Trace and forensic work |
| Long-path gas cell | Vapours and evolved gases | Condensing species | Emissions and decomposition studies |
Internal reflection spectroscopy has its own ASTM practice, E573 3, and the depth of penetration in ATR is wavelength dependent, which is why a spectrum collected on a ZnSe crystal and one collected on diamond are similar but not interchangeable. Our guide to ATR crystal selection covers the material choice; the research question here is whether one crystal can serve every sample the group will bring.
Wavenumber Accuracy and the Calibration Chain
A research instrument produces numbers other people will rely on, so the calibration chain matters more than it does on a QC bench where a single method is validated once.
What a certified standard actually certifies
NIST Standard Reference Material 1921b is a polystyrene film approximately 38 µm thick, certified for the infrared region from 3.2 µm to 18.5 µm, which is 540 cm⁻¹ a 3125 centímetros⁻¹, with thirteen certified band positions at a nominal 23 °C [6]. The certificate was issued on 15 Septiembre 2026, and its expanded uncertainties include an allowance for a temperature range of plus or minus 5 °C, with temperature coefficients supplied for use between 18 °C and 28 °C [6].
Why the uncertainty is not a single number
This is the most useful detail in the certificate and the one most often missed. The expanded uncertainty at 1583.04 cm⁻¹ is 0.09 centímetros⁻¹; at 544.92 cm⁻¹ it is 2.43 centímetros⁻¹ [6]. A specification of “wavenumber accuracy ±1 cm⁻¹” therefore describes the middle of the range and not the end of it, and a research group working near 550 cm⁻¹ needs to know that its reference itself is looser there.
| Certified band | Número de onda | Expanded uncertainty |
|---|---|---|
| 1 | 544.92 centímetros⁻¹ | 2.43 centímetros⁻¹ |
| 6 | 1154.62 centímetros⁻¹ | 0.09 centímetros⁻¹ |
| 7 | 1583.04 centímetros⁻¹ | 0.09 centímetros⁻¹ |
| 10 | 2850.20 centímetros⁻¹ | 0.12 centímetros⁻¹ |
| 13 | 3060.14 centímetros⁻¹ | 0.09 centímetros⁻¹ |
Time-Resolved Work: Kinetics and Hyphenation
Two research capabilities are usually left out of a first tender and then retrofitted at cost.
Rapid scanning allows a spectrum to be collected in a fraction of a second, which is what makes cure kinetics, phase transitions and fast decomposition observable rather than inferred. The limiting factor is usually the detector and the electronics rather than the interferometer.
Hyphenation connects the spectrometer to a separation or a thermal method. TGA-IR follows the gases evolved as a sample is heated; GC-IR separates a mixture before each component is identified. Both are software-and-interface projects as much as optical ones, and both change what the instrument has to be able to do: a fast scan rate, a heated transfer line and a flow cell.
Data, Libraries and Search
The spectrum is the easy part. The research value sits in the library, the search algorithm and the audit trail.
ASTM E1252 sets out general techniques for obtaining infrared spectra for qualitative analysis 4, and ASTM E168 covers the quantitative practices — baseline handling, path length, calibration 5. For identification, ASTM E2310 addresses the use of spectral searching by curve-matching algorithms with mid-infrared data 2, which is the honest description of what a library hit is: a similarity score, not a proof.
| Data question | What to insist on | Why it matters later |
|---|---|---|
| Library scope and licensing | Which libraries, how many spectra, update policy | A hit rate is a property of the library, not the optics |
| Search algorithm | Which algorithm, and whether it is documented | Curve-matching scores are not comparable across algorithms |
| Raw data retention | Interferograms kept, not only processed spectra | Re-processing with a better apodization or baseline is otherwise impossible |
| Audit trail | Who changed what, when | Required the first time a result is challenged |
A Capability Matrix by Research Type
| Research programme | Range | Resolución | Priority accessory | Scan speed |
|---|---|---|---|---|
| Polymer and plastics R&D | 4000–400 cm⁻¹ | 4 centímetros⁻¹ | ATR, plus transmission for films | Standard |
| Coatings and surface chemistry | 4000–400 cm⁻¹ | 4 centímetros⁻¹ | ATR and specular reflection | Standard |
| Catalysis and inorganic materials | 4000–400 cm⁻¹, ideally below 400 | 2–4 cm⁻¹ | DRIFTS, high-temperature cell | Standard |
| Emissions and evolved gases | 4000–400 cm⁻¹ | 1 cm⁻¹ or better | Long-path gas cell, heated line | Fast |
| Trace and contaminant analysis | 4000–400 cm⁻¹ | 4 centímetros⁻¹ | Micro-sampling or microscope | Standard |
| Teaching and method development | 4000–400 cm⁻¹ | 4 centímetros⁻¹ | ATR, robust and easy to clean | Standard |
The matrix is a starting point for a requirement document, not a product recommendation. The correct configuration follows from the two or three programme lines a group actually intends to run in the first two years.
What to Specify in a Tender
| Line to insist on | Why it belongs in writing |
|---|---|
| Wavenumber range, with the accessory fitted | The range changes when a beamsplitter or detector changes |
| Resolution and signal-to-noise at that resolution | One without the other describes a scan nobody can use |
| Wavenumber accuracy across the range, not a single figure | The certified uncertainty varies by more than an order of magnitude [6] |
| Sampling modes supplied and modes available later | Retrofit cost is the largest hidden item |
| Scan rate and time resolution | Decides whether kinetics is possible at all |
| Data format and raw data access | Determines whether results can be re-processed or audited |
| Consumables and service interval | Desiccant, source, laser and liquid nitrogen are recurring costs |
Hidden Costs in a Research FTIR
Four costs do not appear in a quotation and do appear in the first three years of ownership.
Liquid nitrogen, if a cooled detector is specified, is a recurring consumable and a logistics problem. Desiccant and purge matter because KBr optics are hygroscopic, and a humid laboratory will destroy a beamsplitter faster than any sample will. Source and laser replacement are scheduled items, not failures. Library and software licences are usually annual, and a lapsed library turns an identification instrument into a spectrum plotter.
None of these is a reason to buy a lesser instrument. They are the reason a research purchase should be costed over five years rather than at the quotation stage.
Equipment
BRT Testing supplies bench FTIR spectrometers for material laboratories: el BRT-860 y BRT-890 for laboratory work, el BRT-850 for routine identification, y el BRT-8 Plus where a portable instrument has to travel to the sample.
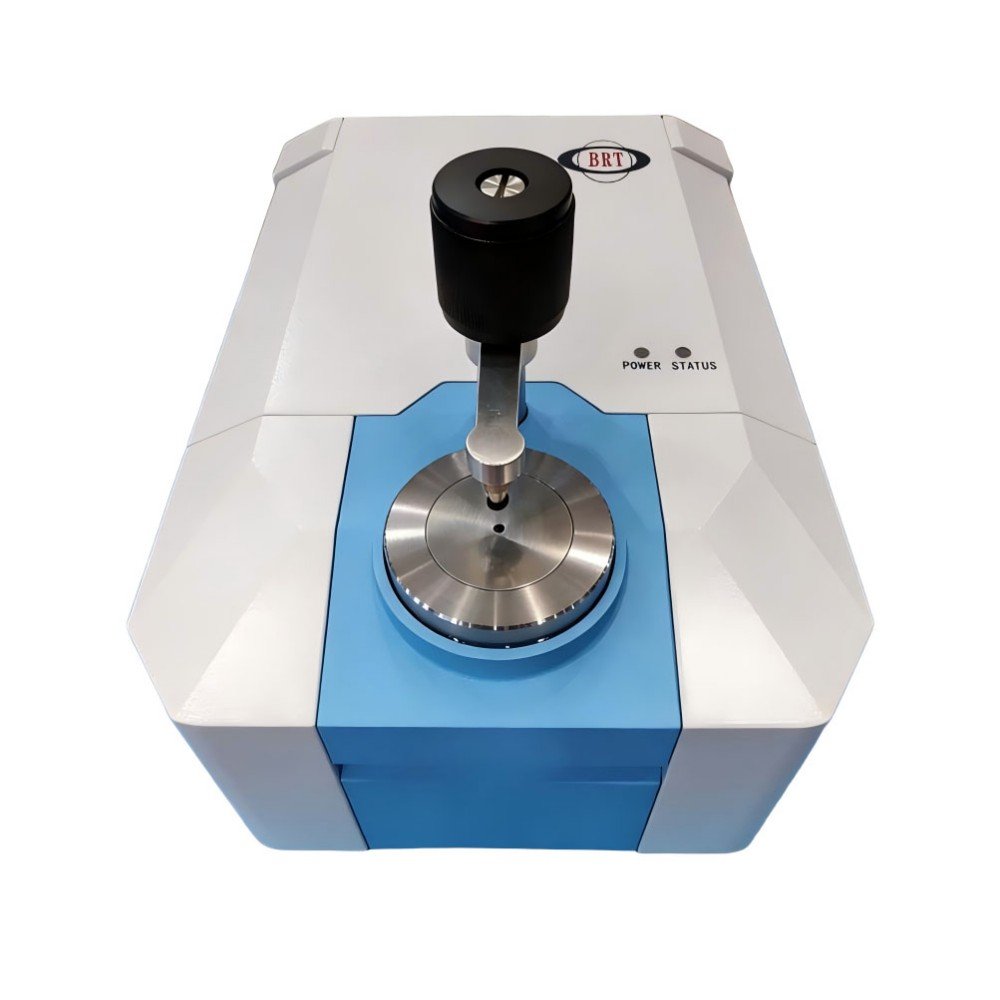
El FTIR spectrometer category lists the full range. If the research question is identification rather than method development, our guide to what an FTIR spectrometer is used for is the better starting point, y el ATR versus transmission selection guide covers the accessory decision in more depth.
Preguntas frecuentes
What resolution does a research FTIR spectrometer need?
It depends on the narrowest feature the programme has to resolve. Polymer identification and most materials work are well served at 4 centímetros⁻¹. Gas-phase speciation, rotational fine structure and small-molecule work need 1 cm⁻¹ or better. Buying higher resolution than the programme needs costs scan time and signal-to-noise without adding information.
Is 4000 a 400 cm⁻¹ enough for materials research?
For polymers, coatings and most organics, Sí. For mineral fillers, metal oxides and lattice vibrations, no — those absorb below 400 cm⁻¹ and need a far-infrared configuration with a different beamsplitter, window and detector. That choice has to be made at purchase because it is an optical change, not an accessory.
What does NIST SRM 1921b certify?
It certifies thirteen absorption band positions in a polystyrene film about 38 µm thick, covering 540 cm⁻¹ a 3125 cm⁻¹ at a nominal 23 °C, with expanded uncertainties that range from 0.09 cm⁻¹ in the middle of the window to 2.43 cm⁻¹ at 544.92 centímetros⁻¹. The certificate was issued on 15 Septiembre 2026 and includes temperature coefficients for use between 18 °C and 28 °C.
Why is signal-to-noise quoted at a specific resolution?
Because the two are linked. A narrower resolution element delivers less energy per scan, so the same number of co-added scans produces a noisier spectrum. A signal-to-noise figure without the resolution it was measured at cannot be compared with another instrument’s figure, and ASTM E1421 exists to make that comparison possible.
Can a portable FTIR replace a bench instrument in a research lab?
Usually not, but it can remove a specific problem. Portable units are built for identification in the field, with fixed sampling geometry and limited accessory options. In a research programme they complement a bench instrument by bringing measurement to samples that cannot be transported, rather than by covering the bench instrument’s capability.
How much does an FTIR spectrometer for research cost?
Quotations vary with range, resolution, accessories and library licensing, so any single figure would be misleading and this article does not quote one. The useful comparison is five-year cost of ownership: instrument, accessories, liquid nitrogen if a cooled detector is specified, desiccant and purge, source and laser replacement, and annual software or library renewals.
Which standard should a tender cite for performance?
ASTM E1421 for describing and measuring the performance of FT-MIR spectrometers, because it defines the measurements in a way that can be compared between vendors. For the calibration chain, cite NIST SRM 1921b and ask for the certificate with the instrument so the band positions can be verified on receipt.
Conclusión: A Decision Order
- List the two or three research programmes the group will actually run in the first two years, not the full wish list.
- From those, derive the wavenumber range, including whether anything sits below 400 cm⁻¹ or above 4000 centímetros⁻¹.
- Set resolution from the narrowest feature, then require signal-to-noise at that resolution, not at a convenient one.
- Choose sampling modes for the sample types, and price the retrofit of any mode deferred to later.
- Decide whether time-resolved work or hyphenation is on the roadmap, because both constrain the optics and the electronics.
- Fix the calibration and data requirements in the tender: SRM 1921b certificate, ASTM E1421 performance data, raw interferogram retention.
Talk to BRT Testing about a BRT-860 o BRT-890 configuration for a material research programme, o get in touch with the sample types and the questions you need the instrument to answer.
About the Author
Written by the BRT Testing application engineering team in Shenyang, Porcelana. BRT Testing builds FTIR spectrometers and sampling accessories for polymer, coating and inorganic materials laboratories. Standard editions, the NIST SRM 1921b certificate and ASTM practice titles were checked on 3 November 2026.
Fuentes
- ASTM — E1421, Describing and Measuring Performance of Fourier Transform Mid-Infrared (FT-MIR) Spectrometers — https://store.astm.org/e1421.html
- ASTM — E2310, Use of Spectral Searching by Curve Matching Algorithms with Mid-Infrared Data — https://store.astm.org/e2310-04.html
- ASTM — E573, Internal Reflection Spectroscopy — https://store.astm.org/e573.html
- ASTM — E1252, General Techniques for Obtaining Infrared Spectra for Qualitative Analysis — https://store.astm.org/e1252.html
- ASTM — E168, General Techniques of Infrared Quantitative Analysis — https://store.astm.org/e168.html
- NIST — Standard Reference Material 1921b, Infrared Transmission Wavelength/Wavenumber Standard, certificate issued 15 Septiembre 2026 — https://tsapps.nist.gov/srmext/certificates/1921b.pdf