The short answer: UV-Vis spectrophotometer calibration is five separate checks — wavelength accuracy, photometric accuracy and linearity, stray light, larghezza di banda spettrale, and baseline stability — each proved with a different reference material and each with its own acceptance limit. It is not one scan of a holmium filter. Laboratories get into trouble because they treat the annual service visit as calibration, use a reference that cannot prove the parameter they are claiming, or compare a measured peak against a certified value recorded at a different spectral bandwidth. Build the programme around the five checks, state the bandwidth beside every wavelength result, and keep records specific enough that a second analyst could repeat the run.

Calibration, Verification and Qualification Are Three Different Jobs
Most confusion here comes from using three words as if they meant the same thing.
| Term | What it establishes | Evidence it produces |
|---|---|---|
| Calibration | Instrument indication against a reference of known value | Comparison with an uncertainty statement |
| Verification | That the instrument still meets a defined specification | Pass or fail against a stated limit, no adjustment implied |
| Qualification | That the instrument is fit for a specific use in a specific laboratory | OQ and PQ documentation tied to that laboratory’s methods |
A service engineer who changes a lamp and prints a spectrum has performed neither calibration nor verification in the formal sense; the printout is a measurement, not a traceable comparison. Accreditation bodies ask for different evidence under each heading, so a procedure titled “calibration” whose content is a pass/fail check against internal limits should be renamed before an auditor renames it for you.
ASTM E275 draws the same line from the instrument side. It is a practice for describing and measuring the performance of ultraviolet and visible spectrophotometers, which means it tells you what to measure and how to express the result, not what your acceptance limit should be 1. The limit is yours to set, and it should come from the tightest tolerance your analytical methods actually need.
The Five Checks That Constitute a UV-Vis Spectrophotometer Calibration
Every credible programme covers the same five parameters. They are not interchangeable, and passing four tells you nothing about the fifth.
Wavelength accuracy and repeatability
Wavelength accuracy asks whether the monochromator delivers the wavelength it claims. Repeatability asks whether it delivers the same wavelength twice. The two fail independently: an instrument can be consistently offset by 0.8 nm (poor accuracy, excellent repeatability) or hover around the correct value with ±0.6 nm scatter (acceptable accuracy, poor repeatability). The first is a correctable systematic error. The second is usually a mechanical or detector fault that no adjustment will fix.
Photometric accuracy and linearity
Photometric accuracy is the difference between the absorbance the instrument reports and the true absorbance of a certified filter or solution. Linearity asks whether that difference stays constant across the range, which is what matters for quantitative work: a 0.004 A bias at 0.5 A is tolerable in many assays, while the same bias at 2.0 A is a 0.2 % relative error. ASTM E169 sets out the general techniques of quantitative ultraviolet-visible analysis and is the right companion when you set linearity limits for an assay method 7.
Luce diffusa
Stray light is radiation reaching the detector at wavelengths the monochromator should have rejected. It is the parameter that quietly destroys high-absorbance measurements, because its effect grows as transmitted energy falls. An instrument with excellent wavelength accuracy and 0.5 % stray light produces a beautifully linear calibration curve that bends at the top end and under-reports concentrated samples. ASTM E387 describes the opaque filter method for estimating the stray radiant power ratio, and it is worth reading before you buy a cut-off filter that tests the wrong wavelength 6.
Larghezza di banda spettrale
Spectral bandwidth is the width of the passband and the parameter most often missing from a calibration programme, because it is awkward to measure. ASTM E958 sets out practices for estimating it 2. This is not a cosmetic specification: bandwidth fixes the height and the apparent position of every absorption peak you measure, which is exactly why it belongs in the same conversation as wavelength accuracy.
Baseline flatness, noise and drift
Baseline stability is measured with nothing in the beam path. Noise limits the smallest absorbance difference you can detect; drift limits how long a batch can run before the baseline moves enough to matter. Both are recorded in absorbance units and both should be checked at the wavelengths your methods use, not only in the middle of the range.
| Parameter | What it controls | Reference material | Consequence if it drifts |
|---|---|---|---|
| Precisione della lunghezza d'onda | Peak identity, qualitative match | Holmium oxide solution or glass | Wrong peak assignment, failed identity tests |
| Wavelength repeatability | Scan-to-scan consistency | Same reference, repeated scans | Poor reproducibility between analysts |
| Photometric accuracy | Absorbance trueness | Certified dichromate or neutral-density standard | Systematic bias in every concentration result |
| Photometric linearity | Response across the range | Multi-level standards | Curved calibration, error at high absorbance |
| Luce diffusa | Usable absorbance ceiling | Cut-off filters or solutions | Non-linear response above about 1 UN |
| Larghezza di banda spettrale | Peak height and position | ASTM E958 estimate | Peak ratios shift, spectra not comparable |
| Baseline flatness and drift | Long-run stability | Empty beam path | Batch drift, failed system suitability |
The Bandwidth Trap in UV-Vis Spectrophotometer Calibration
Here is the detail that separates a real programme from a checklist. Certified peak positions are not constants. They change with the spectral bandwidth at which they were certified.
The NIST certificate for SRM 2034, a holmium oxide solution standard covering 240 nm to 650 nm, certifies the wavelength of minimum transmittance for 14 bands at six spectral bandwidths from 0.1 nm to 3 nm 3. Read the table carefully and the same band moves measurably as bandwidth widens: band 4 sits at 287.03 nm at 0.1 nm bandwidth but at 287.57 nm at 3 nm, a shift of more than half a nanometre. Band 9 moves from 416.02 nm to 416.89 nm across the same range.
| Band | 0.1 nm SBW | 1 nm SBW | 3 nm SBW | Shift, 0.1 A 3 nm |
|---|---|---|---|---|
| 1 | 240.97 | 241.12 | 241.04 | +0.07 |
| 4 | 287.03 | 287.22 | 287.57 | +0.54 |
| 5 | 333.48 | 333.48 | 333.47 | -0.01 |
| 8 | 385.36 | 385.61 | 386.00 | +0.64 |
| 9 | 416.02 | 416.25 | 416.89 | +0.87 |
| 13 | 536.42 | 536.56 | 537.21 | +0.79 |
| 14 | 640.41 | 640.50 | 641.15 | +0.74 |
Values in nanometres, expanded uncertainty U95 of ±0.05 nm or better, from the NIST SRM 2034 certificato [3].
Three consequences follow. Primo, when you compare a measured peak against a reference value, use the column that matches your instrument’s actual bandwidth — otherwise you build a systematic bias of up to 0.9 nm into a check whose tolerance may be only ±1 nm. Secondo, the certificate leaves band 10 blank at the three narrowest bandwidths: below 1 nm that band resolves into two separate minima, so no single certified wavelength exists. If your procedure tells analysts to check “the 451 nm peak” on a high-resolution instrument, the procedure is wrong. Third, ASTM E925 is written for spectrophotometers whose spectral bandwidth does not exceed 2 nm, so a 4 nm instrument sitting on a bench cannot be monitored under that practice at all — widen the bandwidth and you leave the standard’s scope, not just its tolerance 5.
Choosing a Reference Material That Actually Proves the Claim
Reference materials are not interchangeable either. Each is certified for a specific parameter over a specific range, and using it outside that scope produces a result you cannot defend.
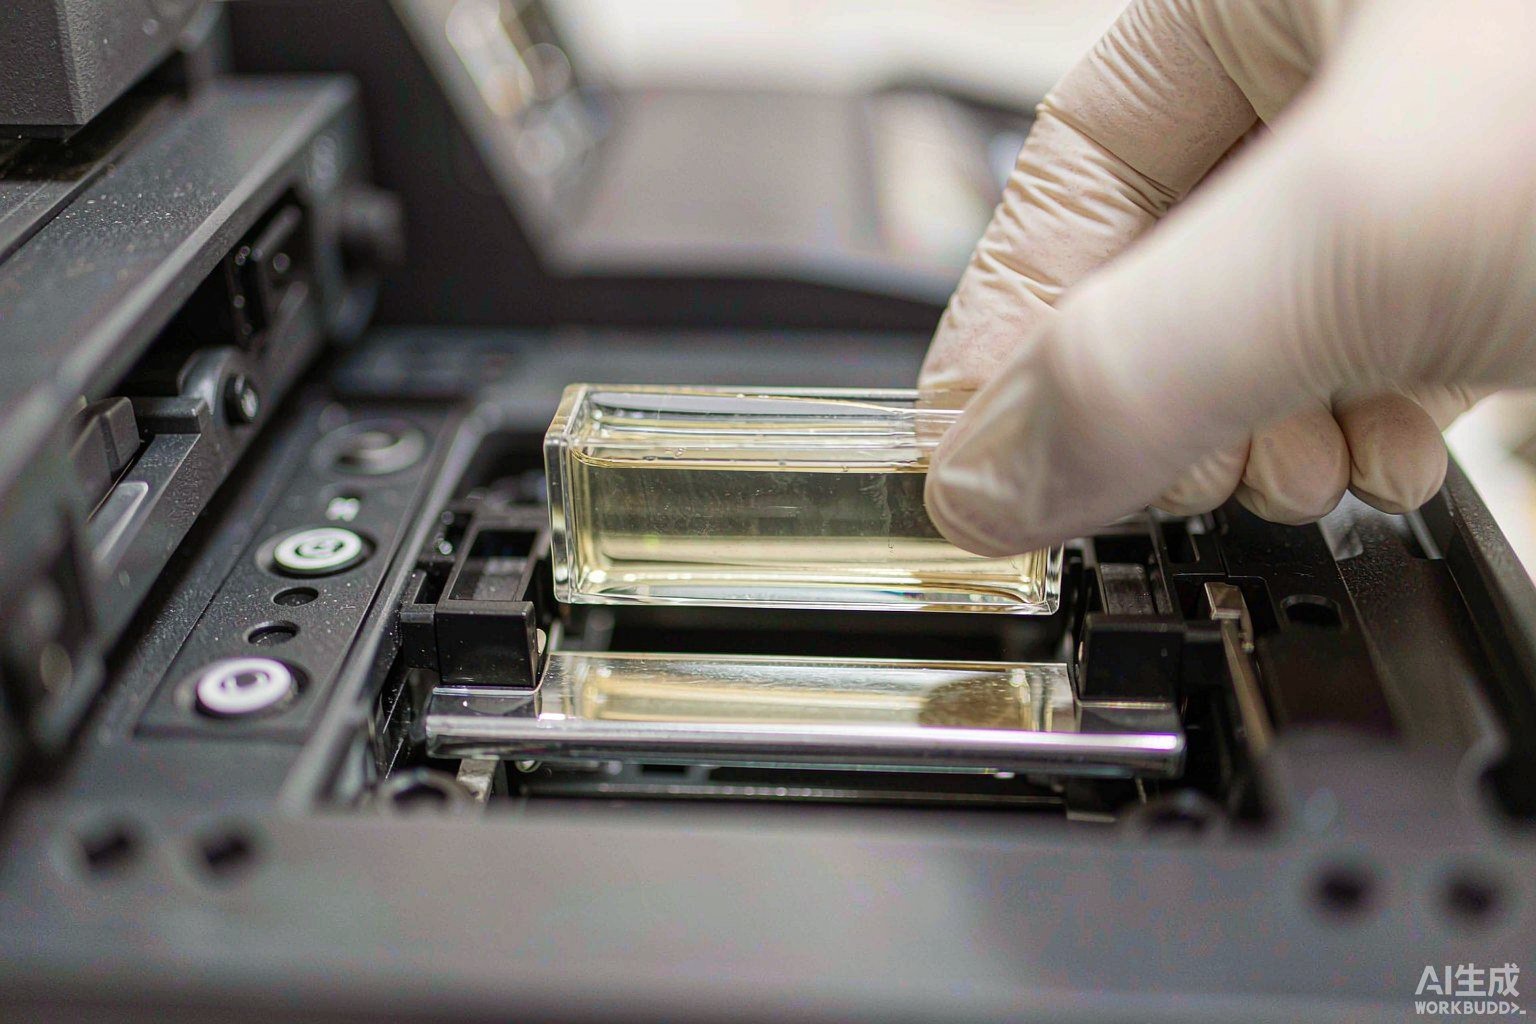
Holmium oxide in perchloric acid is the reference of choice for wavelength accuracy because it gives well-separated minima on both sides of 400 nm. The NIST solution standard is supplied in a sealed 10 mm fused-silica cell with a 12.5 mm square base, and its certification is stated as valid indefinitely provided the cell is handled and stored correctly [3]. Holmium oxide glass filters are more convenient, but the glass matrix broadens and shifts the bands, so certified values cannot be transferred between a solution certificate and a filter.
| Reference material | Parameter proved | Coverage | Watch out for |
|---|---|---|---|
| Holmium oxide solution | Precisione della lunghezza d'onda | 240–650 nm | Sealed cell; values valid only at stated bandwidths |
| Holmium oxide glass filter | Precisione della lunghezza d'onda, routine | about 240–640 nm | Band broadening; use the filter’s own certificate |
| Didymium glass | Precisione della lunghezza d'onda, wide range | about 190–900 nm | Peak positions vary between melts |
| Potassium dichromate solution | Photometric accuracy and linearity | UV, several levels | Concentration and temperature sensitivity |
| Neutral-density filters | Photometric accuracy | Discrete levels | Does not prove linearity between levels |
| Cut-off filters and solutions | Luce diffusa | Specific wavelengths | Must match the wavelength your method relies on |
Whatever you choose, the traceability chain has to be visible in the record: material, lot, certificate number, certified value with uncertainty, and the date the certificate was checked against the supplier’s current issue. NIST publishes certificates openly, which makes independent confirmation straightforward 4, and the Eurachem guide on quantifying uncertainty is the standard reference for stating what the comparison actually proves 9.
Setting Calibration Intervals Without Guessing
There is no universal interval, and a fixed annual visit is usually wrong for both a heavily used teaching instrument and a single-operator QC bench. Build the interval from use and consequence: lamp hours per week, whether the instrument shares a bench, whether results feed release decisions, and how quickly a drift would show up in routine quality-control samples.
ILAC-G24 sets out recognised approaches for establishing and reviewing recalibration intervals, including calendar-based adjustment, usage-based adjustment, and adjustment after in-service checks 8. The practical reading is that an interval is a hypothesis to be tested, not a fixed number to be inherited from a predecessor’s procedure. If five consecutive calibrations pass with a wide margin, the interval can lengthen. If one parameter consumes half the margin, shorten it for that parameter rather than for the whole programme.
Intervention triggers matter as much as the calendar. Change the lamp and the source spectrum changes. Change the slit or bandwidth setting and every certified peak comparison changes. Move the instrument between rooms and the baseline may shift with temperature. Replace a cell and photometric accuracy must be re-proved, because a scratched or mismatched cell is one of the most common causes of an apparent instrument fault.
| Trigger | Minimum response | Record required |
|---|---|---|
| New instrument or relocation | Full five-parameter calibration | Certificate, limits, verdict |
| Lamp replacement | Wavelength and photometric accuracy | Before and after values |
| Monochromator or slit adjustment | All five parameters | Bandwidth stated on record |
| Cell replacement | Photometric accuracy | Cell identity and pairing |
| Failed system suitability | Investigation before further use | Root cause, corrective action |
| Routine interval reached | Abbreviated wavelength and photometric | Trend against previous runs |
Documenting a Record That Survives an Audit
A record that says “instrument verified, within specification” is worth nothing six months later. A second analyst has to be able to reconstruct the comparison from the document alone.
| Field | Why the record needs it |
|---|---|
| Reference identity and lot | Proves which certified article was actually used |
| Certified values and uncertainty | Without U95 the comparison has no defensible tolerance |
| Larghezza di banda spettrale | Peak positions are only valid at the stated bandwidth |
| Measured values, not just verdicts | Enables trending and retrospective review |
| Acceptance limits and their origin | Shows the limit came from the method, not from habit |
| Cell identity and pairing | A mismatched cell mimics an instrument fault |
| Ambient temperature | Baseline and lamp output both drift with temperature |
| Instrument ID, firmware, lamp hours | A calibration before a firmware update is not evidence after it |
Two fields are routinely forgotten: the cell, because photometric checks are meaningless if nobody recorded which cell was used, and the software, because many instruments apply internal correction factors. Trending is what turns records into management information — a wavelength offset that walks from 0.1 nm to 0.4 nm over four calibrations is a warning even while every individual result passes.
Where UV-Vis Spectrophotometer Calibration Programmes Fail
The failures are consistent across laboratories of very different sizes. The most common is treating a single holmium filter as the whole programme, which proves wavelength accuracy and nothing else. The second is quoting a tolerance without a bandwidth, which makes the result non-reproducible. The third is calibrating at wavelengths the methods never use; an instrument verified only at 280 nm e 640 nm tells you nothing about a 340 nm assay. The fourth is filing a supplier’s factory certificate as your own calibration evidence. The fifth is skipping stray light because the reference is inconvenient, then wondering why concentrated samples read low.
If you are specifying a new instrument, ask for the calibration accessories and reference materials as a line item rather than an afterthought. A spectrophotometer without a certified reference is an unverified instrument, and assembling the reference set later usually costs more than buying it with the instrument. The BRT UV-Vis range — from the compact BRT-1100UV through the BRT-1150UV E BRT-6100UV to the BRT-5000UV — is listed with optical specifications on the UV-Vis spectrophotometer category page, so you can check bandwidth and stray light against the limits your methods need before you shortlist.
The narrower question of how to run the wavelength and stray light tests, with the arithmetic behind a pass or fail call, is covered in the companion article on UV-Vis wavelength accuracy and stray light verification. That article is the procedure; this one is the programme around it. If you are still choosing an optical configuration, the UV-Vis spectrophotometer buying guide compares single-beam and double-beam architectures, and the explanation of how a spectrophotometer measures absorbance covers the measurement chain that calibration is trying to constrain.
Domande frequenti
How often should a UV-Vis spectrophotometer be calibrated?
There is no single interval that fits every laboratory. Set the full five-parameter calibration at commissioning, after any optical intervention, and then at an interval derived from lamp hours and the consequence of a wrong result. Many QC laboratories run the full calibration annually, an abbreviated wavelength and photometric check quarterly, and a system suitability standard every batch. Trending the deviations tells you more than the calendar does.
What reference material is used for wavelength calibration?
Holmium oxide is the usual choice because it produces well-separated minima on both sides of 400 nm. The NIST SRM 2034 solution is certified for 14 bands between 240 nm e 650 nm at six spectral bandwidths. Holmium oxide glass filters and didymium glass are also used; both are convenient, but their certified values belong to that specific filter and cannot be carried over from a solution certificate.
Can I use a holmium oxide glass filter instead of the solution?
SÌ, for routine checks, provided you compare against the filter’s own certificate. The glass matrix broadens the absorption bands and shifts them slightly relative to a solution, so a correct filter checked against solution values will appear to fail. For the highest-confidence work, especially below 300 nm, the sealed solution cell remains the better reference.
What is the difference between calibration and verification?
Calibration compares an instrument’s indication with a reference of known value and states the uncertainty of that comparison. Verification confirms the instrument still meets a defined specification and may involve no adjustment. Qualification documents fitness for a specific use in a specific laboratory. The three require different records and are often confused when a service report is filed as calibration evidence.
Why does wavelength accuracy pass at 280 nm but fail at 640 nm?
A wavelength error that grows towards the visible end usually points to the monochromator drive, a mis-set slit, or a lamp change that altered the source geometry. It can also be an artefact of comparing against certified values recorded at a different spectral bandwidth, since peak positions shift measurably as bandwidth widens. Check the bandwidth first, then the drive.
Does a calibration certificate make my results traceable?
Only if the certificate names the reference material, its lot, the certified values with uncertainties, and the conditions of the comparison. A certificate stating “instrument within specification” without those details does not establish traceability, because nobody can reconstruct what was compared with what. Traceability is a property of the documented comparison chain, not of the document’s title.
What stray light level should a UV-Vis spectrophotometer have?
The level your methods need, measured at the wavelength where your highest-absorbance measurements are made. Stray light matters most when absorbance is high, so a check at 340 nm is irrelevant to a method that reads at 600 nm. Set the limit from the maximum absorbance in your method and the error you can accept there, then pick a filter that tests that region.
Conclusione: Build the Sequence, Then Repeat It
Order matters less than completeness, but a sequence that works is: confirm thermal stability, establish the baseline, prove spectral bandwidth, then wavelength accuracy at the bandwidth you just established, then photometric accuracy and linearity, then stray light, and finally record everything with reference lots and limits attached.
If you are assembling a programme for a new instrument, or replacing reference materials whose certificates have lapsed, the BRT application team can supply the accessory list alongside the specification. Start from the UV-Vis spectrophotometer category or send us the method tolerances you have to meet, and we will tell you which optical configuration and which reference set will prove them.
Written by the BRT Testing application team, Shenyang Baoruitong Automation Equipment Co., Ltd. — manufacturers of UV-Vis spectrophotometers, FTIR spectrometers and fire-test instrumentation for laboratories in more than 40 countries.
Fonti
- ASTM International — E275 Standard Practice for Describing and Measuring Performance of Ultraviolet and Visible Spectrophotometers — https://store.astm.org/standards/e275
- ASTM International — E958 Standard Practice for Estimation of the Spectral Bandwidth of Ultraviolet-Visible Spectrophotometers — https://store.astm.org/standards/e958
- NIST — Certificate, Standard Reference Material 2034, Holmium Oxide Solution Wavelength Standard (240 nm to 650 nm) — https://tsapps.nist.gov/srmext/certificates/2034.pdf
- NIST — Standard Reference Materials catalogue — https://www.nist.gov/srm
- ASTM International — E925 Standard Practice for Monitoring the Calibration of Ultraviolet-Visible Spectrophotometers whose Spectral Bandwidth does not Exceed 2 nm — https://store.astm.org/standards/e925
- ASTM International — E387 Standard Test Method for Estimating Stray Radiant Power Ratio of Dispersive Spectrophotometers by the Opaque Filter Method — https://store.astm.org/standards/e387
- ASTM International — E169 Standard Practices for General Techniques of Ultraviolet-Visible Quantitative Analysis — https://store.astm.org/standards/e169
- ILAC — ILAC-G24, Guidelines for the determination of recalibration intervals of measuring equipment used in testing laboratories — https://ilac.org/?p=124892/
- Eurachem — Quantifying Uncertainty in Analytical Measurement (QUAM), third edition — https://www.eurachem.org/images/stories/Guides/pdf/QUAM2012_P1.pdf