La respuesta corta
FTIR spectroscopy for pharmaceutical analysis is at its most defensible where the question is identity, and least defensible where the question is what is inside a heterogeneous finished product below the surface. The technique itself is uncontroversial: ASTM E1252 covers general techniques for obtaining infrared spectra for qualitative analysis from 4000 cm⁻¹ hasta 50 centímetros⁻¹, for liquid-, sólido- and vapour-phase samples 1. What decides whether a result survives a GMP inspection is the fit between the sampling technique and the question. ATR reads roughly 0.5–2 µm into the sample 4; a coated tablet is not a surface. This article maps where FTIR belongs in a pharmaceutical QC laboratory — identity, raw-material confirmation, solid-form screening, stability trending, cleaning support — and where its limits are, with the regulatory hooks each use carries.
Where FTIR Fits in a Pharmaceutical QC Laboratory
Identity confirmation is the compendial core
The compendial use is identity. USP general chapter <197>, Spectroscopic Identification Tests, is where infrared identification lives: monographs across the USP-NF cite the infrared test as <197k>, the potassium bromide pellet preparation 18, and the chapter’s procedure instructs recording the spectra of the test specimen and the corresponding USP reference standard over the range from about 2.6 µm en 15 µm (3800 a 650 centímetros⁻¹) unless otherwise specified in the individual monograph, with the acceptance criterion that the IR absorption spectrum of the preparation corresponds to that of the corresponding reference standard 3. That wording sets the operating model for incoming raw materials: compare against a reference spectrum measured under the same preparation, and the comparison — not a library score alone — is the test. For most organic excipients and APIs, an ATR accessory makes this a minute-scale, non-destructive measurement, which is why ATR has become the default at goods-in.
What the technique is, formally
ASTM E1252 describes the general techniques for qualitative infrared analysis across 4000–50 cm⁻¹ and notes that the techniques are often useful into the near-infrared region as well [1]. Its quantitative sibling, ASTM E168, covers the techniques most often used in infrared quantitative analysis, including computer-based data collection 2. The division of labour matters for a QC laboratory: qualitative identity is the everyday FTIR task, and quantitative assay by FTIR is possible but must be justified against HPLC alternatives — regulators expect the method of choice to be the one with the strongest validation story, not the newest instrument.
The ATR depth problem on finished products
The single most important physical limitation is sampling depth. A peer-reviewed critical review puts the ATR penetration depth for mid-IR at 0.5–2 µm depending on the crystal and wavenumber, giving a sampled volume of roughly 10 µm³, against around 75 mm³ for NIR reflectance and 10 mm³ for Raman [4]. The same review notes that finished pharmaceutical products can be relatively inhomogeneous, so a larger sampled volume or multiple spatial points gives more reliable results [4]. En la práctica: ATR-FTIR on a homogeneous powder or an intact film reads the surface truthfully; ATR-FTIR across a coated, compressed tablet reads a 2 µm slice of a multi-millimetre object. Two operational consequences follow. Primero, sample preparation — scraping, sectioning, grinding to a homogeneous powder for a 197K pellet — is not a deviation from the technique, it is what makes the technique applicable. Segundo, any surface-coating claim (coat identity, coat degradation) is one of the few places where the shallow depth is an advantage rather than a defect: depth-resolved ATR-FTIR imaging studies read coating degradation directly because the information depth rarely exceeds 2 µm 7.
Solid Form: Polymorphs, Hydrates and What Mid-IR Actually Probes
Where mid-IR works and where it does not
Mid-IR probes vibrations of functional groups, and that is both its power and its polymorph problem. A peer-reviewed evaluation across ten polymorphic pharmaceuticals states it plainly: characterization and discrimination among polymorphs using mid-IR spectroscopy is not always possible in part because the technique mainly probes vibrational modes arising from functional groups, and the far-infrared region offers high discriminating power for polymorphs compared to the mid-infrared spectral region — a fingerprint for discrimination among polymorphs even if the mid-IR region does not show significant differences 8. For a QC laboratory, the honest position is: mid-IR is a fast screen for solid-form differences that express themselves in functional-group bands, hydrate and solvate changes included — FT-IR is described as probably the quickest and easiest method to investigate hydrates, because hydration changes hydrogen bonding that IR sees directly 9 — but a negative mid-IR comparison does not certify the same solid form. Where solid form is the release-critical attribute, XRPD or thermal methods carry the claim, with FTIR as supporting evidence.
The crystal choice follows the sample
ATR crystal selection for pharmaceutical work follows three verified numbers. Diamante: depth of penetration 2.0 µm at 1000 centímetros⁻¹, usable pH 1–14, chemically and physically robust, with an intrinsic absorption band roughly between 2300 y 1800 centímetros⁻¹ 5 6. ZnSe: the same 2.0 µm penetration, but useful pH limited to 5–9 and a low-wavenumber cutoff around 650 cm⁻¹ — fine for most organic powders, wrong for strong acids and bases [5][6]. Germanio: 0.66 µm penetration at 1000 cm⁻¹ thanks to its high refractive index, which is exactly what you want for strongly absorbing samples [5][6]. nuestra guía para ATR crystal selection — ZnSe vs diamond vs Ge covers the trade-offs in detail.
| Cristal | Penetration at 1000 centímetros⁻¹ | Useful range notes | Best pharmaceutical fit |
|---|---|---|---|
| Diamante | 2.0 µm | pH 1–14; intrinsic band ~2300–1800 cm⁻¹ | Universal goods-in work, abrasive or caustic samples |
| ZnSe | 2.0 µm | pH 5–9; cutoff ~650 cm⁻¹; soft, scratches | Clean organic powders, excipients |
| Germanio | 0.66 µm | High refractive index; strongly absorbing samples | Carbon-filled or very dark samples, high-absorbance APIs |
The Regulatory Frame a Pharmaceutical FTIR Result Lives In
Records: the spectra themselves are named in 21 CFR 211
The strongest regulatory hook for FTIR in pharma QC is explicit. 21 CFR 211.194(a) requires laboratory records to include complete data derived from all tests necessary to assure compliance with established specifications, and paragraph (a)(4) requires a complete record of all data secured in the course of each test, including all graphs, charts, and spectra from laboratory instrumentation 10. The spectrum is not supporting material — it is the record. The same section requires that the suitability of all testing methods used shall be verified under actual conditions of use [10], and paragraph (d) requires complete records of the periodic calibration of laboratory instruments [10]. A benchtop FTIR without a documented PQ, wavenumber verification and a polystyrene calibration record is not producing defensible identity data.
Method validation: ICH Q2(R2) covers spectroscopic data
The FDA’s final guidance Q2(R2) Validation of Analytical Procedures, issued March 2024 alongside Q14 Analytical Procedure Development, provides a general framework for the principles of analytical procedure validation, including validation principles that cover the analytical use of spectroscopic data 13 14 15. That clause matters for every chemometric FTIR method — identity libraries and PLS quantitation included — because it closes the old ambiguity about whether multivariate spectroscopic methods fit the classical validation parameters. For stability-indicating claims, Q2(R2) includes demonstration of stability-indicating properties as a defined section [15], and the stability programme itself still runs on Q1A(R2), Stability Testing of New Drug Substances and Products, Noviembre 2003 16.
Pruebas, trending and stability in EU GMP Chapter 6
EU GMP Volume 4, Chapter 6, requires that testing methods should be validated, and that a laboratory using a method it did not validate should verify the appropriateness of the testing method 11. It also requires results of parameters identified as quality attributes to be trended [11], and the on-going stability programme to include relevant physical, chemical, microbiological and biological test methods across the shelf life [11]. FTIR’s role in that structure: identity at goods-in, solid-form and hydrate checks that feed trend evaluation, and a fast identity re-check on stability time-point samples where the specification allows it.
Cleaning verification: the honest scope
EU GMP Annex 15 requires that all analytical test methods used in qualification, validation or cleaning exercises should be validated with an appropriate detection and quantification limit where necessary, that cleaning validation confirms the effectiveness of any cleaning procedure for all product contact equipment, and that sampling is by swabbing and/or rinsing with recovery shown from all product contact surfaces 12. What FTIR contributes is method support — for example confirming the identity of a residue isolated on a swab — not a dedicated quantitative swab method; where specific residue testing is not feasible, Annex 15 names total organic carbon and conductivity as representative parameters [12]. Claiming FTIR as a cleaning-validation quantitation technique without that validation story is the kind of gap an inspector finds quickly.
FTIR, NIR and Raman: Drawing the Boundary
| Dimensión | FTIR (mid-IR, ATR) | NIR | Raman |
|---|---|---|---|
| Profundidad de muestreo | 0.5–2 µm [4] | 1–3 mm, ~75 mm³ volume [4] | 1–3 mm, ~10 mm³ volume [4] |
| Through packaging | No — requires sample handling and direct contact [4] | Yes in reflectance | Sí, generally |
| Water interference | Strong | Water bands informative (humedad) | Weak scatterer — aqueous-friendly [4] |
| Best pharma role | Identidad, surface/coat analysis, solid-form screen | Humedad, blend uniformity, through-pack ID | Solid-form, in-process, acuoso |
The PAT framing from FDA’s 2004 guidance completes the picture: at-line measurement where the sample is removed and analysed close to the process, on-line where the sample is diverted and may be returned, in-line where it is not removed 17. ATR-FTIR is inherently an at-line technique because of its contact requirement; NIR owns the in-line slot for moisture and blend endpoints; Raman owns in-process solid-form work. For the broader capability map, ver what a FTIR spectrometer is used for. Peer-reviewed ATR-FTIR imaging has demonstrated in-line dissolution monitoring — water penetration and polymer erosion rates read directly from images [7] — but that is a development-laboratory capability, not a routine QC bench method.
Preguntas frecuentes
Is FTIR acceptable for identity testing under GMP?
Sí, and it is the compendial default. USP general chapter <197> covers infrared identification — monographs cite the pellet preparation as <197k> [18] — and requires the sample spectrum to correspond to the reference standard over the 3800 a 650 cm⁻¹ range unless the monograph specifies otherwise [3]. What GMP adds around it: 21 CFR 211.194 requires the spectra themselves to be retained as laboratory records and the method’s suitability verified under actual conditions of use [10].
Why does ATR sometimes miss what a KBr pellet shows?
Depth. ATR reads 0.5–2 µm into the sample while a pellet presents a homogeneous bulk [4]. On a coated tablet or a layered granule, the two preparations genuinely interrogate different material. If the release question is bulk composition, grind and pellet (or use transmission); if the question is the surface — coat identity, degradation, contamination — ATR’s shallow depth is the feature [7].
Can FTIR distinguish polymorphs?
Sometimes, and never conclusively by mid-IR alone. Mid-IR probes functional-group vibrations, so it discriminates polymorphs only where the form changes those bands; a ten-polymorph evaluation found the far-IR region adds discriminating power that mid-IR lacks [8]. Hydrates and solvates, which change hydrogen bonding, are well within FT-IR’s reach [9]. For release-critical solid-form claims, use XRPD or thermal analysis with FTIR as support.
Which ATR crystal should a pharma QC lab buy?
Diamond for the universal goods-in accessory: pH 1–14, robust, 2.0 µm penetration, accepting an intrinsic band around 2300–1800 cm⁻¹ [5][6]. ZnSe is the economical alternative for clean organic powders but is limited to pH 5–9 and scratches [5]. Germanio, en 0.66 µm penetration, is the choice for strongly absorbing samples [5][6].
Do I still need KBr pellets if I have ATR?
For most identity work, no — ATR is faster and non-destructive, y el <197> comparison procedure accepts any preparation that reproduces the reference spectrum, pellet or ATR [3]. Keep pellet capability for cases where bulk homogeneity or a literature/compendial reference spectrum measured as a pellet is the comparison basis, and for strongly absorbing or irregular surfaces where contact fails.
¿Qué significa ICH Q2?(R2) change for FTIR methods?
It closes the spectroscopy gap explicitly: the final FDA guidance, issued March 2024, states its validation principles cover the analytical use of spectroscopic data [13][15]. For a chemometric identity library or a quantitation model, validate against Q2(R2) parameters — specificity, rango, robustness, and where relevant the stability-indicating demonstration — rather than improvising a validation design [15].
Can FTIR be used for cleaning validation?
As support, not as the quantitation engine, unless you validate it for that job. Annex 15 requires analytical methods used in cleaning exercises to be validated with appropriate detection and quantification limits, sampling by swabbing or rinsing with recovery demonstrated, and names TOC and conductivity as the representative parameters where specific residue testing is not feasible [12]. FTIR fits as the identity confirmation on isolated residues.
Conclusión: Build the FTIR Role Around the Question
FTIR spectroscopy for pharmaceutical analysis earns its bench space on identity: compendial, rápido, and explicitly recognised in the record-keeping and validation frameworks — 21 CFR 211.194 names spectra, and Q2(R2) names spectroscopic data [10][13]. Extend it to solid-form screening with the mid-IR caveat in mind, use its shallow ATR depth deliberately for surfaces and coatings, and route quantitative and cleaning claims through a validation story before an inspector asks for one.
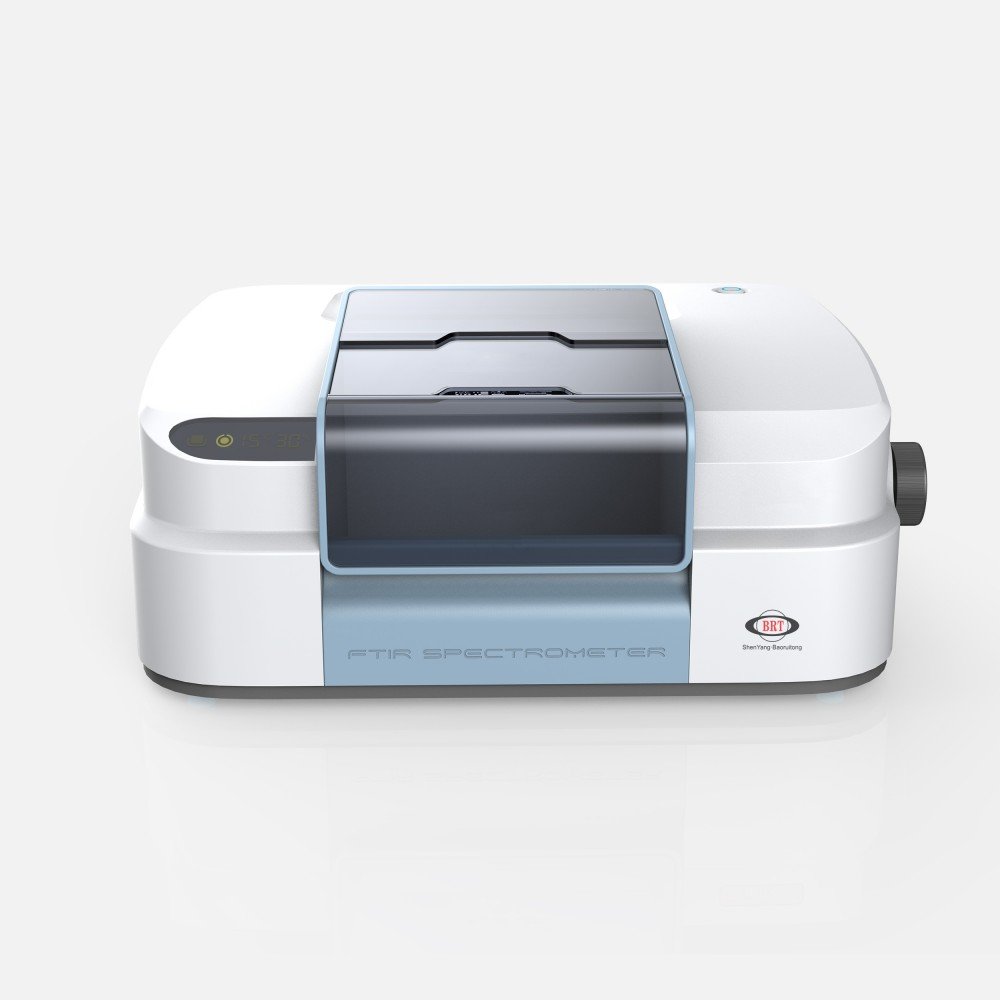
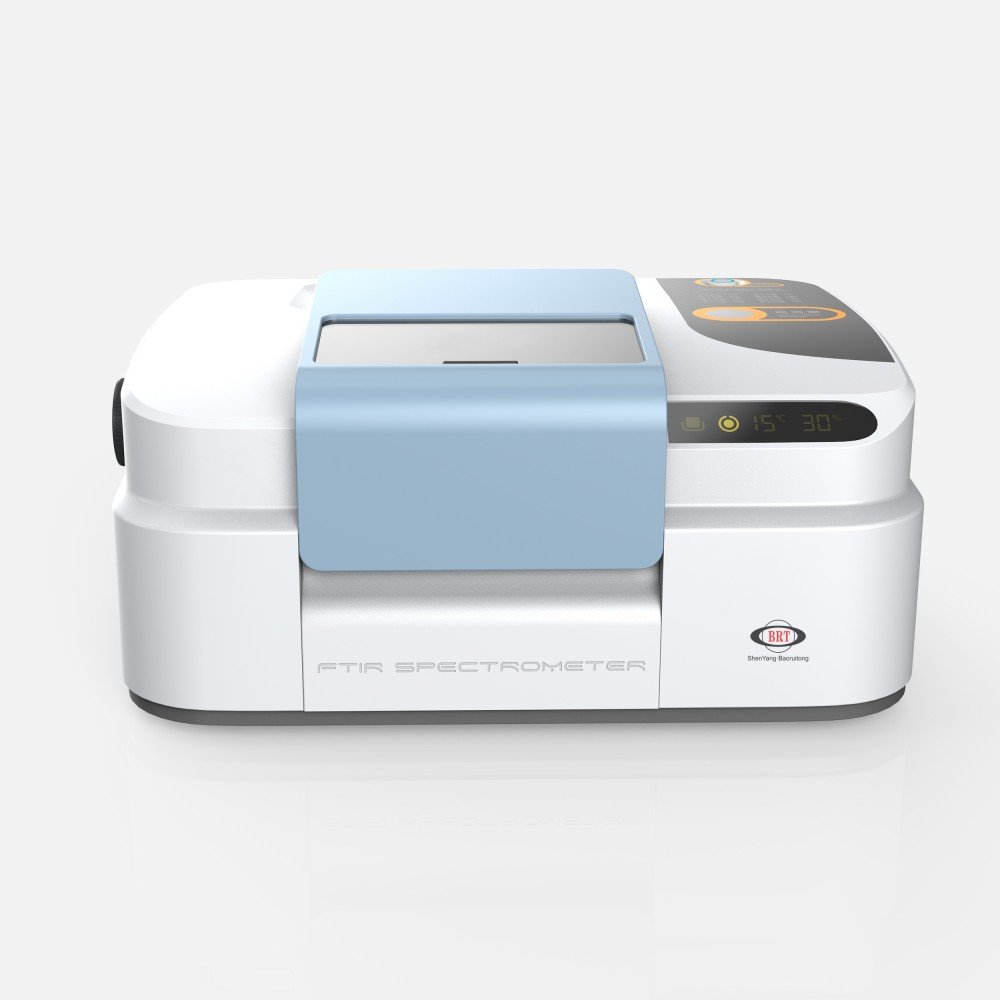
BRT construye el BRT-890 FTIR spectrometer for benchtop QC identity work, el BRT-860 FTIR spectrometer for routine multi-user laboratories, y el BRT-850 FTIR spectrometer where a compact footprint meets standard ATR workflows. If you are weighing benchtop against portable optics first, comienza con nuestro Guía de selección de espectrómetro FTIR, then tell us the dosage forms, the batch volumes and the compendial tests on your schedule, and we will match the instrument and accessory set to the method.
Sobre el autor
Escrito por el equipo de contenido de BRT Testing - Shenyang Baoruitong Automation Equipment Co., Limitado., un fabricante de equipos de prueba de fuego y llamas e instrumentos de análisis de materiales. This article is written for pharmaceutical QC managers and analysts who need spectroscopic results that stand up to a GMP inspection.
Fuentes
- ASTM International — ASTM E1252-98(2021), Práctica estándar para técnicas generales de obtención de espectros infrarrojos para análisis cualitativo (página oficial de la tienda). https://store.astm.org/e1252-98r21.html
- ASTM International — ASTM E168-16(2023), Prácticas estándar para técnicas generales de análisis cuantitativo infrarrojo (página oficial de la tienda). https://store.astm.org/e168.html
- USP <197> infrared identification procedure text — reproduced verbatim in Biosorption of dicloxacillin from pharmaceutical waste water using tannin from Indian almond leaf, Biotechnology Reports (2020) (open access). https://pmc.ncbi.nlm.nih.gov/articles/PMC7305391/
- Deidda R., Sacré P.-Y., Clavaud M., Coïc L., Avohou H., Hubert P., Ziemons E., Vibrational spectroscopy in analysis of pharmaceuticals: Critical review of innovative portable and handheld NIR and Raman spectrophotometers, TrAC Trends in Analytical Chemistry 114 (2019) 251–259 (author accepted manuscript). https://orbi.uliege.be/bitstream/2268/233370/1/TrAC_2018_483_Manuscript_REVISED.pdf
- Thermo Fisher Scientific — Smart iTR ATR Sampling Accessory, crystal specifications (official product page). https://www.thermofisher.com/order/catalog/product/222-247000
- Thermo Fisher Scientific — Technical Note 52598, Capabilities and Performance of the Smart iTX Accessory (official PDF). https://assets.thermofisher.com/TFS-Assets/CAD/Application-Notes/TN52598-E%200714M-Smart%20iTX-web.pdf
- Advances in ATR-FTIR Spectroscopic Imaging for the Analysis of Tablet Dissolution and Drug Release (peer-reviewed, open access). https://pmc.ncbi.nlm.nih.gov/articles/PMC10301043/
- Far-Infrared Spectroscopy as a Probe for Polymorph Discrimination (peer-reviewed, open access). https://pmc.ncbi.nlm.nih.gov/articles/PMC6486452/
- Pharmaceutical Hydrates Analysis — Overview of Methods and Recent Advances (peer-reviewed, open access). https://pmc.ncbi.nlm.nih.gov/articles/PMC7601571/
- US FDA — 21 CFR 211.194, Laboratory records (current e-CFR text). https://www.law.cornell.edu/cfr/text/21/211.194
- European Commission — EudraLex Volume 4, Chapter 6, Quality Control (revisión 28 Marzo 2014, official PDF). https://health.ec.europa.eu/document/download/c74c8720-27bf-4252-808f-d65a206a90bb_en?filename=2014-11_vol4_chapter_6.pdf
- European Commission — EudraLex Volume 4, Annex 15, Qualification and Validation (in operation 1 Octubre 2015, official PDF). https://health.ec.europa.eu/document/download/7c6c5b3c-4902-46ea-b7ab-7608682fb68d_en?filename=2015-10_annex15.pdf
- US FDA — Q2(R2) Validation of Analytical Procedures, final guidance, Marzo 2024 (official guidance page). https://www.fda.gov/regulatory-information/search-fda-guidance-documents/q2r2-validation-analytical-procedures
- US FDA — Q14 Analytical Procedure Development, final guidance, Marzo 2024 (official guidance page). https://www.fda.gov/regulatory-information/search-fda-guidance-documents/q14-analytical-procedure-development
- US FDA — Federal Register 89 FR 16582, availability of final guidances Q2(R2) y Q14, 7 Marzo 2024 (official PDF). https://www.govinfo.gov/content/pkg/FR-2024-03-07/pdf/2024-04834.pdf
- US FDA — Q1A(R2) Stability Testing of New Drug Substances and Products, Noviembre 2003 (official guidance page). https://www.fda.gov/regulatory-information/search-fda-guidance-documents/q1ar2-stability-testing-new-drug-substances-and-products
- US FDA — PAT: A Framework for Innovative Pharmaceutical Development, Fabricación, and Quality Assurance, guidance for industry, Octubre 2004 (official guidance page). https://www.fda.gov/regulatory-information/search-fda-guidance-documents/pat-framework-innovative-pharmaceutical-development-manufacturing-and-quality-assurance
- Chollet M., Jozwiakowski MJ, Ward JM, Beachy MA, Quality investigation of hydroxyprogesterone caproate active pharmaceutical ingredient and injection, Drug Development and Industrial Pharmacy 38:10 (2012) — cites the USP <197k> infrared identification test as a monograph specification (open access). https://pmc.ncbi.nlm.nih.gov/articles/PMC3399637/