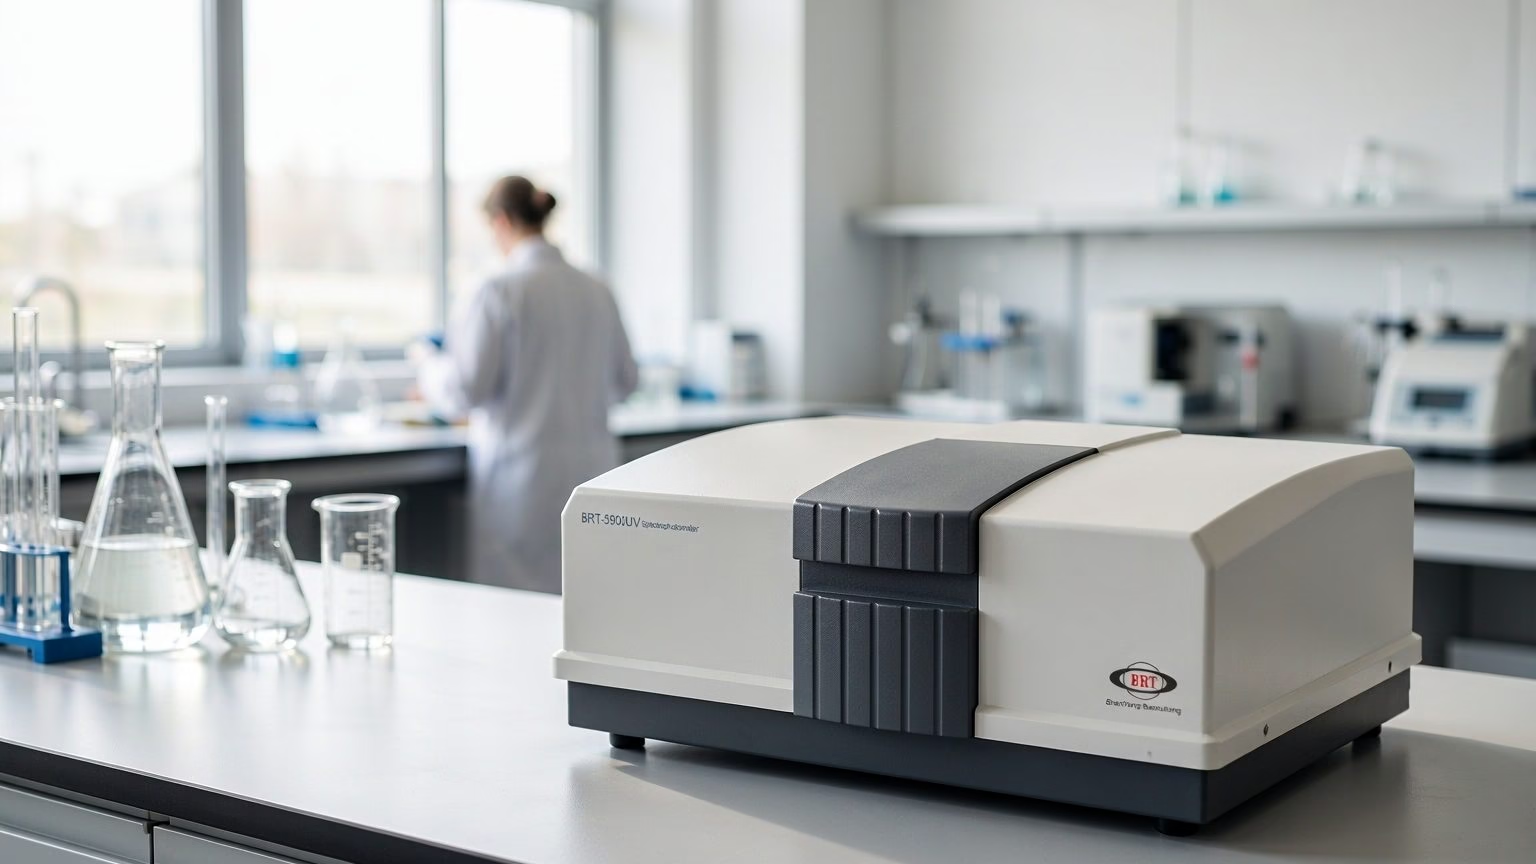
A spectrophotometer does not measure darkness — it measures a ratio. It splits broadband light into a narrow band, passes that band through your sample, and compares how much arrives at the detector against how much arrived with only the solvent in the beam. That comparison, expressed as a logarithm, is absorbance. Every step of the process — the reference reading, the ratio, the log conversion, the bandwidth selected — has a failure mode, and understanding the chain is what separates a number you can defend from a number you merely printed.
From Lamp to Detector: Where the Number Comes From
The Five Stages of the Measurement
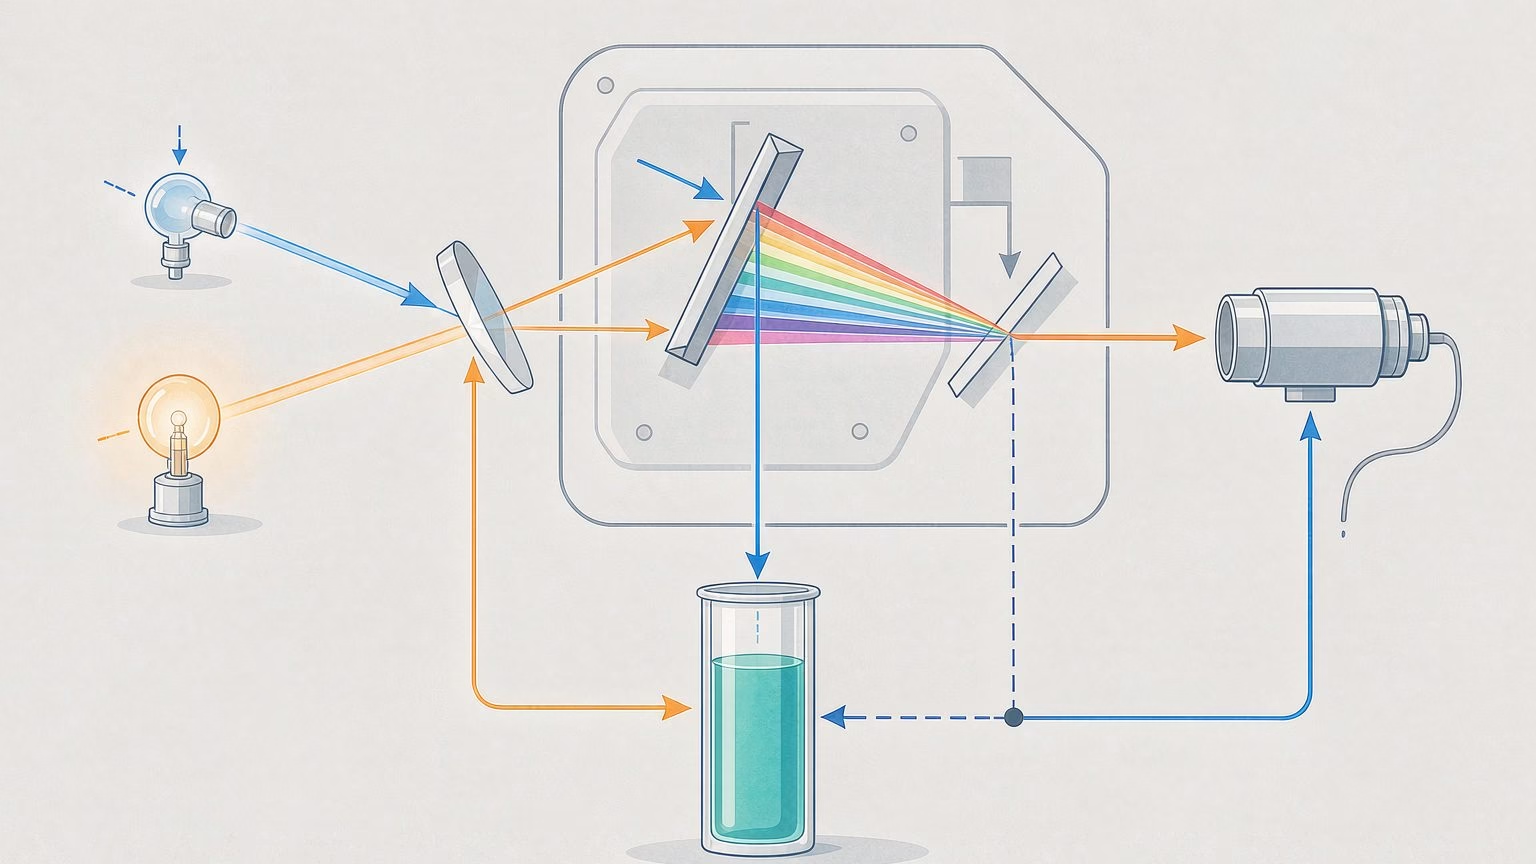
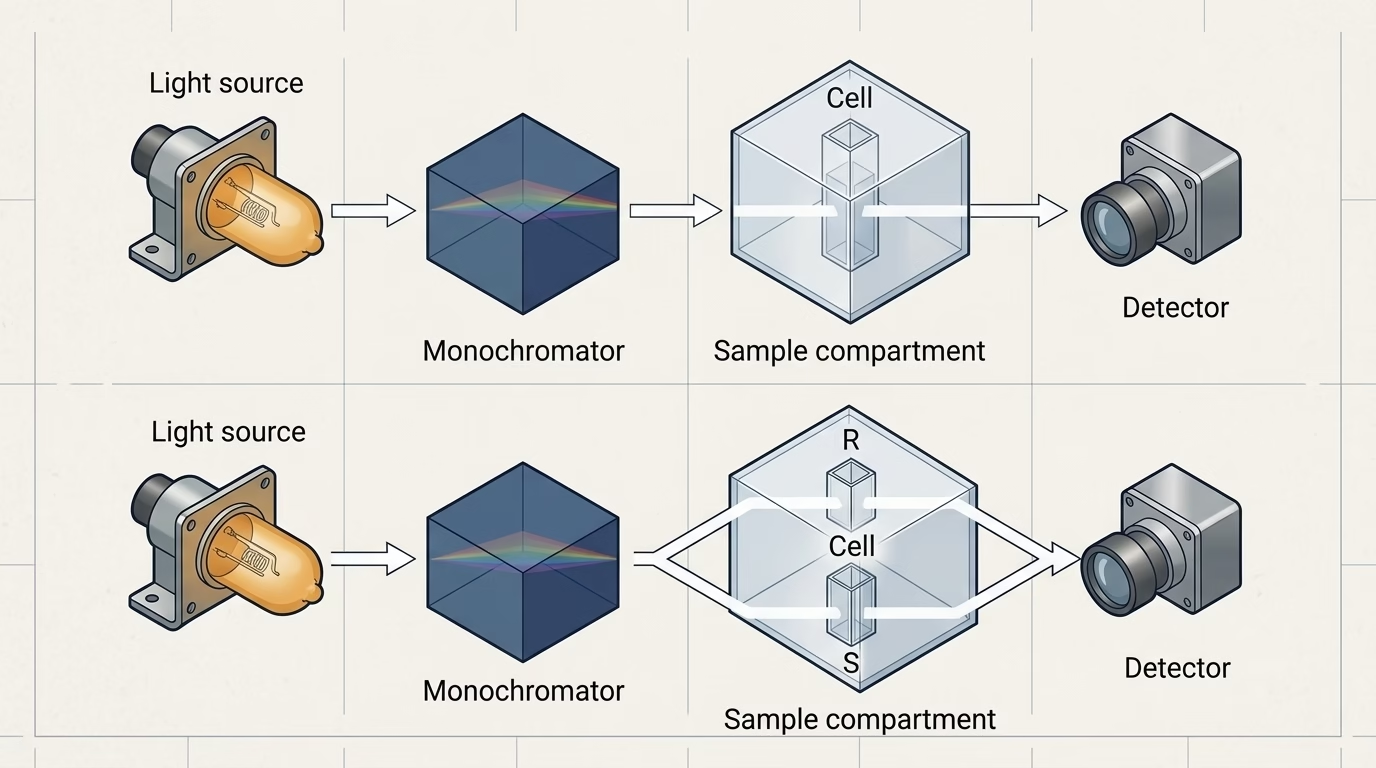
A UV-Vis spectrophotometer is a ratiometric instrument, and it helps to picture the five stages the light passes through. D'abord, un source — typically a deuterium lamp for the ultraviolet and a tungsten-halogen lamp for the visible, together covering roughly 190 nm to 1100 nm on a routine instrument 8 — provides broadband energy. Deuxième, un monochromateur selects a narrow band from that continuum; the width of the band it lets through is the spectral bandwidth, and it is not infinitely narrow. Third, the beam enters the sample compartment, where a cuvette holds the solution at a precisely defined path length, conventionally 10 mm. Fourth, un détecteur — usually a silicon photodiode for routine instruments — converts the arriving photons into an electrical signal. Fifth, electronics take that signal through the ratio and the logarithm.
The essential point is stage five. The detector never measures “absorption”. It measures light arriving, twice, and everything downstream is arithmetic from those two readings 1. It also means the detector works hardest when the sample is doing the least, and vice versa: a weakly absorbing sample passes nearly all of the light, so errors in the reference reading dominate, while a strongly absorbing sample leaves only a trickle, so detector noise and unwanted light dominate. Most instruments also subtract a dark-signal reading taken with the beam blocked, which removes the detector own dark offset from both I and I₀ but does nothing for light that arrives by the wrong route.
Two Readings, One Result
Call the light reaching the detector with solvent only in the beam I₀ — the incident intensity. Call the light reaching the detector with your analyte in the beam je — the transmitted intensity. Nothing else is measured. Transmittance is the ratio:
T = I / I₀, usually quoted as percentage transmission, %T = 100 × I / I₀.
Absorbance is the negative decadic logarithm of that ratio: A = −log₁₀T = log₁₀(I₀ / je) 2. The instrument computes this in firmware, and it is worth being clear that absorbance is a derived quantity rather than a direct physical measurement. If your reference and sample cuvettes are mismatched, if the blank was taken two hours ago on a drifting lamp, or if the detector is seeing light at the wrong wavelength, the arithmetic still executes perfectly on corrupted inputs.
Because I₀ has to be established, the order of operations matters. On a single-beam instrument you blank, puis lis l'exemple; on a double-beam instrument the reference is monitored continuously while the sample is read, so source drift between the two events is compensated rather than merely small. Either way the quotient is the same — only its stability differs.
Why Absorbance Is a Logarithm
Transmittance Falls Exponentially; Absorbance Does Not
Hold a coloured solution up to the light and add another centimetre of thickness. The fraction of light surviving does not halve and then halve again by addition — it is multiplied by another factor. Doubling the path length squares the transmittance; doubling the concentration squares it too. Transmittance is therefore exponential in both concentration and path length, which makes it a poor reporting scale: a straight line is impossible to draw through it, and equal steps of concentration give wildly unequal steps of signal.
Taking the negative decadic logarithm converts multiplication into addition. It also produces a quantity that is directly proportional to the amount of absorbing species in the beam. That is the whole reason the scale exists.
The Beer–Lambert Law
The relationship that falls out is the Beer–Lambert law, written for a single absorbing species as:
A = ε · c · l
where UN is absorbance (dimensionless), ε is the molar decadic absorption coefficient in L·mol⁻¹·cm⁻¹, c is concentration in mol·L⁻¹, et l is path length in cm 3. Two properties follow immediately and are worth committing to memory:
- Double the concentration, or double the path length, and absorbance doubles. A calibration curve through the origin should be a straight line.
- Absorbance is additive across independent absorbing species at the same wavelength. A blank that absorbs interferes with everything measured at that wavelength, which is why blank matching is not housekeeping but measurement [3].
It is also why the same reading can be rescued without touching the chemistry: if your sample reads too high, halve the path length rather than diluting, and the arithmetic of the law is unchanged.
How a Spectrophotometer Measures Absorbance Under Real Conditions
The definitions assume monochromatic light, a perfect detector and a chemically inert solution. Real instruments satisfy none of these completely, and each shortfall shows up in the number.
| Source of deviation | What the reading does | How you notice it | Ce qu'il faut faire |
|---|---|---|---|
| Lumière parasite (any light outside the selected band reaching the detector) | Reads faible; effect grows sharply as true absorbance rises | Calibration curve bends downward at high standards; the curve plateaus | Test with cut-off solutions or filters; keep readings within the verified range; service optics 4 |
| Finite spectral bandwidth | Depresses and broadens peaks where absorbance changes rapidly with wavelength | Peak height lower than literature values; neighbouring peaks merge | Reduce bandwidth until the peak height stops increasing |
| Wavelength error | Reads low anywhere off the true peak; large effect on steep band edges | λmax differs from literature by more than ~1 nm | Verify the wavelength scale against a certified standard 5 |
| Sample fluorescence | Adds signal to the detector, so reads faible | Apparent absorbance depends on geometry and cuvette position | Move to a different wavelength or change the assay |
| Chemical association, dissociation or pH drift | Non-linear calibration even with a perfect instrument | Curve bends but flattens again on dilution | Buffer the system and run standards in the same matrix |
| Particulates and turbidity | Scatters light out of the beam, reads high and unstable | Readings drift as particles settle | Filter or centrifuge; do not treat scattering as absorbance |
Stray Light Sets the Ceiling
Stray light deserves its own note because it is the dominant limit at the top of the range, and it is the one that surprises people. Any light outside the selected band that reaches the detector is counted as though it had passed through the sample. Since your sample may block 99.9 % of the light at the chosen wavelength, even a tiny legitimate-looking amount of off-wavelength light becomes a large fraction of what actually arrives.
The instrument and reference literature describes stray light as producing apparent negative deviations from Beer’s law, and it is tested with cut-off filters and solutions [4]6. The practical consequence is arithmetic: at an absorbance of 1.0 only 10 % of the incident light reaches the detector; à 2.0 only 1 % does; à 3.0 only 0.1 %. The meaningful signal becomes small enough that whatever light should not be there starts to dominate. One representative benchtop datasheet quotes stray light of ≤0.10 %T measured at 220 nm with sodium iodide and at 340 nm with sodium nitrite, with photometric accuracy of ±0.002 A over 0–0.5 A, widening to ±0.008 A over 1.0–2.0 A 7. Note the pattern rather than the numbers: published accuracy tolerances themselves widen as absorbance climbs.
Wavelength Accuracy Decides Whether the Reading Is on-Peak
Absorbance is measured at one wavelength, and the coefficient ε is wavelength-dependent. If the monochromator delivers light 2 nm away from where the display says, and if that point sits on a steep flank of the band, the reading drops for reasons nothing to do with concentration. This is why wavelength accuracy and stray light verification belongs in every quantitative method rather than in annual servicing only.
Reading the Number Correctly
What the Scale Actually Means
| Absorbance A | Transmittance %T | What it implies for your method |
|---|---|---|
| 0.000 | 100 % | Blank; no absorbing species in the beam |
| 0.301 | 50 % | Half the light absorbed |
| 0.500 | 31.6 % | Comfortable mid-range for routine quantitative work |
| 1.000 | 10 % | Only one tenth of the light reaches the detector |
| 2.000 | 1 % | Requires demonstrably low stray light and verified photometric accuracy |
| 3.000 | 0.1 % | Beyond the verified range of most routine benchtop instruments |
Routine quantitative methods are usually built so that standards and unknowns fall in the middle rows. When a sample reads above roughly 1.5 UN, shorten the path length rather than accepting the reading: un 1 mm cell brings a 1.5 A reading to 0.15 A using the same solution, with no dilution error introduced.
The Cuvette Is Part of the Measurement
Because absorbance depends on path length, the cell belongs to the calibration rather than to the sample. A standard square cell has a 10.00 mm optical path, and any departure from that figure scales the result directly — but so does behaviour that has nothing to do with the nominal dimension. UV light below roughly 340 nm is absorbed by ordinary glass and by most disposable plastics, which appear as sample absorbance and can swamp a real peak; UV-grade quartz is specified for that reason. Scratches and fingerprints scatter light out of the beam, and the resulting loss is indistinguishable from absorption. Matched cells are calibrated as pairs and should be replaced as pairs, because swapping one half of a pair changes the very ratio the instrument is reporting. Finally, orientation matters: rotate a cell and you may change which face the beam enters, so a good habit is to index the cell in the holder and return it the same way every time.
Verification: Proving the Instrument Still Reads True
Absorbance accuracy is not self-evident. Nothing on the display tells you whether the reading is true. It is checked against reference materials whose values are certified, using a documented method and defined intervals, so that the result can be defended rather than merely repeated — and the verifications have standardised homes.
| Paramètre | Why it governs absorbance | How it is checked | Where the method lives |
|---|---|---|---|
| Précision de la longueur d'onde | Selects where on the band you are reading | Scan a certified wavelength standard and compare peak positions | Covered under UV-Vis performance testing practice [5] |
| Photometric accuracy | Governs whether A itself is correct | Measure certified neutral-density filters or solutions of known absorptivity | Special Reference Materials maintained for this purpose [1] |
| Lumière parasite | Sets the usable upper limit of the absorbance range | Measure cut-off solutions that should transmit nothing at the test wavelength | Standard test method for estimating stray radiant power [4] |
| Practical techniques | Sample handling, cell selection, quantitative procedure | Follow standard practice for ultraviolet-visible quantitative analysis | General techniques standard [3] |
NIST maintains standard reference materials specifically intended for the verification of photometer and spectrophotometer performance [1], and ASTM maintains both the performance-testing practice and the stray-light method referenced above [4][5]. Using them turns “the instrument is calibrated” into a documented statement with a certificate behind it.
Whether the reference is re-measured continuously or only once — which decides how much source drift enters the result and how often a blank has to be re-run — is treated in full in our comparison of single-beam and double-beam spectrophotometers, and the component-level walkthrough is in UV-Vis spectrophotometer working principle and applications.
Choosing Configurations and Consumables
Because the absorbance reading depends on a ratio taken inside one instrument, the components you can change are the ones that alter the ratio: the cuvette, the bandwidth and the instrument class itself.
| Requirement | What to specify | Why it maps to absorbance accuracy |
|---|---|---|
| Measurements below ~340 nm | UV-grade quartz cells | Glass and most plastics absorb strongly in the UV and are read as sample absorbance |
| Readings above ~1.5 A without dilution | Short-path cells (1 mm, 2 mm) | Uses Beer–Lambert linearity instead of fighting instrument limits |
| Sharp bands with small natural bandwidth | Narrow spectral bandwidth (0.5–1 nm) | Wide bandwidth depresses measured peak absorbance |
| Long kinetic readings or scanning | Double-beam architecture | Reference is continuously re-measured, so drift does not enter the ratio |
| Regulated quantitative methods | Documented photometric and wavelength performance | Audit trail needs a certificate, not an assertion |
BRT Testing builds across that span: the entry single-beam BRT-1100UV covers routine absorbance reading, le BRT-1800UV adds a wider working range for teaching and QC laboratories, the double-beam BRT-5600UV et BRT-5800UV suit kinetic work where the reference must be tracked continuously, and the research-grade BRT-6100UV is specified for the narrow-bandwidth, low-stray-light cases described above. The full line is listed under UV-Vis spectrophotometers.
Foire aux questions
How does a spectrophotometer measure absorbance?
It takes two readings of the same light beam. A reference measurement with only the solvent in the path gives the incident intensity, and a second measurement with the sample gives the transmitted intensity. The instrument divides the second by the first to obtain transmittance, then applies a negative decadic logarithm to report absorbance.
Why is absorbance logarithmic instead of linear?
Transmittance falls exponentially with concentration and path length, so it cannot be plotted as a straight line. Taking the logarithm converts exponential decay into arithmetic addition, which makes absorbance directly proportional to both concentration and path length — the relationship expressed by the Beer–Lambert law.
What is the difference between absorbance and transmittance?
Transmittance is the raw ratio of transmitted to incident light, quoted from 0 à 100 %. Absorbance is the negative decadic logarithm of that ratio. An absorbance of 1.0 corresponds to 10 % transmittance, and an absorbance of 2.0 corresponds to 1 % transmittance.
What is a good absorbance range for quantitative work?
The middle of the scale. Below about 0.1 A the reading is dominated by noise and blank mismatch; above roughly 1.5 A stray light and detector limits begin to compress the result. Best practice is to choose a path length or dilution that places standards and unknowns between about 0.2 A and 1.0 UN.
Why does my calibration curve bend at high concentrations?
Either the chemistry or the instrument is departing from Beer–Lambert behaviour. The most common instrumental cause is stray light, which makes readings progressively too low as true absorbance rises. Chemical causes include association, dissociation and pH drift. Running a cut-off filter test separates the two explanations quickly.
How often should absorbance accuracy be verified?
Often enough that a drift cannot outlive a batch of results. A practical schedule checks wavelength accuracy and stray light at defined intervals, uses certified reference materials with traceable values, and repeats verification after any lamp change or optical service. Regulated laboratories codify the interval in their own procedures.
Does single-beam or double-beam change how absorbance is calculated?
Non. Both designs compute the same ratio and the same logarithm. The difference is whether the reference reading is taken once before the sample or monitored continuously alongside it, and that difference determines how much source drift enters the result.
Measuring Absorbance With Confidence
Work outward from the ratio. D'abord, verify that the instrument’s wavelength scale is correct, because reading off-peak changes every result downstream. Deuxième, verify photometric accuracy against certified reference materials so that absorbance itself, not just its stability, is known to be true. Third, check stray light before you trust anything above 1.5 UN, or a shortened cell instead of accepting a compressed result. Fourth, match the blank to the sample matrix, since absorbance is additive and a mismatched blank is a systematic error. Fifth, write the reading range into the method so that every operator keeps results in the middle rows of the table above. Once those five steps are routine, how a spectrophotometer measures absorbance stops being an instrument question and becomes a method question — which is where it belongs.
BRT Testing supplies UV-Vis and FTIR spectrophotometers from entry single-beam units to research-grade double-beam systems, together with the cells, reference filters and software supporting routine quantitative work. Send us your analyte, its expected concentration range and the wavelengths you work at, and we will return a recommended configuration with the acceptance checks it has to pass before you sign for it.
Prepared by the applications team at Shenyang Baoruitong Automation Equipment Co., Ltée. (Tests BRT), a manufacturer and exporter of UV-Vis and FTIR spectrophotometers and fire testing equipment. Company information is available on our about page, and technical enquiries can be directed through our page de contact.
Sources
- NIST — Standard Reference Materials
- NIST — Spectrophotometry
- ASTM International — E169-16 Standard Practices for General Techniques of Ultraviolet-Visible Quantitative Analysis
- ASTM International — E387-04 (reapproved 2014) Standard Test Method for Estimating Stray Radiant Power Ratio of Dispersive Spectrophotometers by the Opaque Filter Method
- ASTM International — E275-08 (reapproved 2013) Standard Practice for Describing and Measuring Performance of Ultraviolet and Visible Spectrophotometers
- ASTM International — E387 Standard Test Method for Estimating Stray Radiant Power Ratio of Dispersive Spectrophotometers by the Opaque Filter Method
- Edinburgh Instruments — DS5 double-beam UV-Vis spectrophotometer data sheet
- Edinburgh Instruments — UV-Vis Spectroscopy