The Short Answer
FTIR measures how a sample absorbs infrared light; Raman measures the small fraction of monochromatic laser light that is inelastically scattered and shifted in energy. In short, FTIR vs Raman spectroscopy is a comparison of absorption with scattering, not of better with worse. That physical difference decides which bonds each method sees and which samples each handles well. FTIR responds to a change in dipole moment, so it is strong on polar, heteronuclear groups such as O–H and is the routine choice for identification and for fluorescent or coloured samples. Raman responds to a change in polarizability, so it sees homonuclear bonds and can separate C–C, C=C and C≡C; it largely disregards water, works non-contact through transparent containers, and is often preferred for aqueous samples. The two methods are complementary, not substitutes: a laboratory needing defensible identifications across unknown matrices usually specifies both.
The Physical Difference That Drives Every Other Difference
Every practical distinction follows from one fact: the two techniques detect vibrations through different physical events. The IEC preview defines an FTIR analyzer through an interferogram and a Fourier Transform yielding an absorption spectrum, and a Raman analyzer as one using inelastic scattering of monochromatic laser light, with photon energy shifted up or down to reveal vibrational and rotational modes 4. Neither is better than the other; they observe the same molecules through different windows.
What FTIR measures
FTIR is absorption spectroscopy: infrared light passes through or reflects from a sample and the instrument records which wavenumbers are absorbed. ASTM E1252 covers 4000 cm−1 to 50 cm−1 and includes techniques useful for qualitative analysis of liquid-, solid- and vapour-phase samples by infrared spectrometric techniques 1. Because absorption requires a change in dipole moment, polar bonds give intense bands and an infrared spectrum is rich in functional-group information 8.
What Raman measures
Raman isolates the tiny scattered component whose energy differs from the laser by a molecular vibration, plotted as a Raman shift [4]. Because the effect requires a change in polarizability rather than dipole moment, it highlights different bonds and often gives a cleaner fingerprint [8]. The weak signal is why laser choice matters.
Selection Rules: Why the Two Methods See Different Bonds
When you compare FTIR vs Raman spectroscopy, the selection rule is the most useful concept. Infrared absorption requires a change in dipole moment, making FTIR sensitive to polar heteronuclear groups including O–H; Raman requires a change in polarizability, making it sensitive to homonuclear bonds and able to differentiate C–C, C=C and C≡C [8]. A group strong in one spectrum may be weak in the other, so a negative FTIR result is not proof a bond is absent.
| Property | FTIR | Raman |
|---|---|---|
| Physical event | Infrared absorption | Inelastic scattering of monochromatic light [4] |
| Selection rule | Change in dipole moment [8] | Change in polarizability [8] |
| Strongest features | Polar heteronuclear groups, O–H [8] | Homonuclear bonds, C–C / C=C / C≡C [8] |
| Typical spectrum | Functional-group rich | Backbone and lattice sensitive |
| Keyword to remember | Dipole | Polarizability |
A laboratory running only FTIR can miss information Raman shows directly, and the reverse is true; the two are complementary, not competitive 7.
Aqueous Samples, Coloured Samples and Containers
Water and aqueous matrices
Water is the most common reason to reach for Raman. Its Raman signal is very weak, so Raman spectroscopy virtually disregards water in samples, while FTIR is an absorption method in which water absorbs strongly across much of the infrared [7]. For solutions and formulations the analyte fingerprint is easier to isolate, provided the matrix does not fluoresce. FTIR can still handle aqueous work with a suitable accessory and short path length, but water subtraction becomes part of the method.
Fluorescence, colour and sealed containers
Fluorescence is the reason to reach for FTIR. Many coloured samples produce optical noise called fluorescence during Raman sampling, which can obscure the fingerprint, whereas FTIR spectroscopy is ideal for fluorescent samples [7]. Raman sampling is non-contact and non-destructive [8] and works point-and-shoot through containers and vials [7]. The container is not invisible: glass can mask Raman bands, and quartz gives a lower background at 785 nm 10. Confirm vessel and wavelength before trusting a through-container result.
Wavelength Choice in Raman: 532, 633, 785 and 1064 nm
Visible excitation gives the strongest Raman signal and the most fluorescence. Renishaw lists visible lasers at 405–660 nm, including 532 and 633 nm, and infrared options at 785, 830 and 1064 nm, noting that near-IR or UV reduces fluorescence 9. Raman intensity scales with the inverse fourth power of wavelength, and spot diameter follows 1.22λ/NA — about 0.72 µm at 532 nm and 1.1 µm at 785 nm with 0.90 NA and 100× optics 11. Red and near-IR excitation around 660–830 nm is the practical band for fluorescence suppression [11].
| Laser | Typical role | Trade-off |
|---|---|---|
| 532 nm | High signal, general-purpose [9] | Strongest fluorescence risk [9] |
| 633 nm | Visible compromise [9] | Fluorescence still common [9] |
| 785 nm | Near-IR workhorse, lower fluorescence [9][11] | Weaker signal, larger spot [11] |
| 1064 nm | Maximum fluorescence suppression [9] | Weakest scattering signal [11] |
Lasers bring a safety obligation: IEC 60825-1:2014 Edition 3.0 covers 180 nm to 1 mm, with a stability date of 2027 12. Build laser class, interlocks and training into the specification.
Sample Preparation and Non-Contact Workflows
Sampling is where the physics becomes a workflow decision. FTIR commonly needs contact or preparation: ATR pressing, grinding with Nujol, KBr discs or NaCl plates are all standard routes [8]. Each adds consumables, technique dependence and a cleaning step. Raman analysis is non-contact and non-destructive [8], and a point-and-shoot measurement through a vial [7] removes much of that handling, which matters for hazardous, valuable or sealed samples. The exception is the container itself: glass can mask Raman bands while quartz gives a lower background at 785 nm [10]. For transmission FTIR accessories and crystal choice, see our FTIR spectrometer selection guide: ATR vs transmission.
Calibration and Performance Verification
FTIR: wavenumber and performance levels
FTIR verification has two layers: the wavenumber axis and instrument performance. ASTM E1421 describes two levels of tests for laboratory Fourier transform mid-infrared spectrometers with a standard transmission sample holder, organised as Level Zero and Level One; it does not apply to flow cells, reflectance accessories, FT-NIR or step-scan instruments 2. For the axis, NIST SRM 1921b is a 38 µm polystyrene film with a 25 mm exposed area that calibrates 3.2–18.5 µm (540–3125 cm−1) using thirteen centroid bands from 544.92 to 3082.22 cm−1, with expanded uncertainties of 0.09–2.43 cm−1 (k=4), valid to 31 December 2027 and intended for resolution of 4 cm−1 or better 5.
Raman: shift axis and intensity
Raman verification separates shift position from band shape. ASTM E1840 covers Raman shift values for common liquid and solid chemicals usable for wavenumber calibration, but does not include calibration procedures 3. For intensity correction, NIST SRM 2241 is a chromium-doped sodium borosilicate glass certified at 785 nm over 200–3500 cm−1, valid to 31 December 2026, with no 532 or 633 nm equivalent and a cross-reference to ASTM E1840 6. Check certificate dates: a material expiring in the instrument’s first year is a real operating cost.
Where Each Method Sits in Formal Methods
Standardised methods show where each technique is accepted. ISO 23978:2020 describes a laser Raman method for the quantitative determination of chemical composition of natural gas in the upstream area (ISO/TC 193/SC 3, confirmed 2026) 13, and ASTM D7940-21 addresses LNG by fiber-coupled Raman 14. Raman therefore has a clear gas-analysis footprint. FTIR’s footing is wider in general qualitative infrared practice, as ASTM E1252 shows [1]. When a client names a method, start from that document; a technique it does not reference cannot be substituted.
Application Matching Table
Choose by the decisive factor, not by preference.
| Application | Decisive factor | Method |
|---|---|---|
| Routine unknown identification | Polar functional groups and library match [1] | FTIR [8] |
| Fluorescent or strongly coloured sample | Fluorescence obscures Raman fingerprint [7] | FTIR [7] |
| Aqueous solution or formulation | Water gives very weak Raman signal [7] | Raman [7] |
| Sealed vial or container check | Non-contact measurement through vial [7][10] | Raman [7][10] |
| Carbon backbone vs unsaturated bonds | Polarizability changes in C–C / C=C / C≡C [8] | Raman [8] |
| Polymer additive and side-group work | Dipole-sensitive polar groups [8] | FTIR [8] |
| Upstream natural gas composition | Laser Raman method formalised [13] | Raman [13] |
| LNG composition | Fiber-coupled Raman standard [14] | Raman [14] |
For a broader spectroscopic comparison, read our FTIR vs UV-vis guide; for material-specific examples see FTIR analysis for polymers and plastics.
Specifying an Instrument Programme
Turn the comparison into criteria a supplier can answer.
| Parameter | FTIR criterion | Raman criterion |
|---|---|---|
| Spectral range | 4000–50 cm−1 coverage per E1252 [1] | Shift range covering the analyte bands [3][6] |
| Verification document | ASTM E1421 Level Zero / Level One [2] | ASTM E1840 shift values [3] |
| Reference material | SRM 1921b polystyrene film, valid to end 2027 [5] | SRM 2241 at 785 nm, valid to end 2026 [6] |
| Sampling mode | ATR contact, Nujol, KBr or NaCl [8] | Non-contact, through-vial capable [7][8] |
| Container effect | Accessory and crystal dominate | Glass masks bands; quartz at 785 nm [10] |
| Laser safety | Not laser-excited for the measurement | IEC 60825-1 class and interlocks [12] |
| Fluorescent sample | Preferred route [7] | Consider near-IR or UV excitation [9][11] |
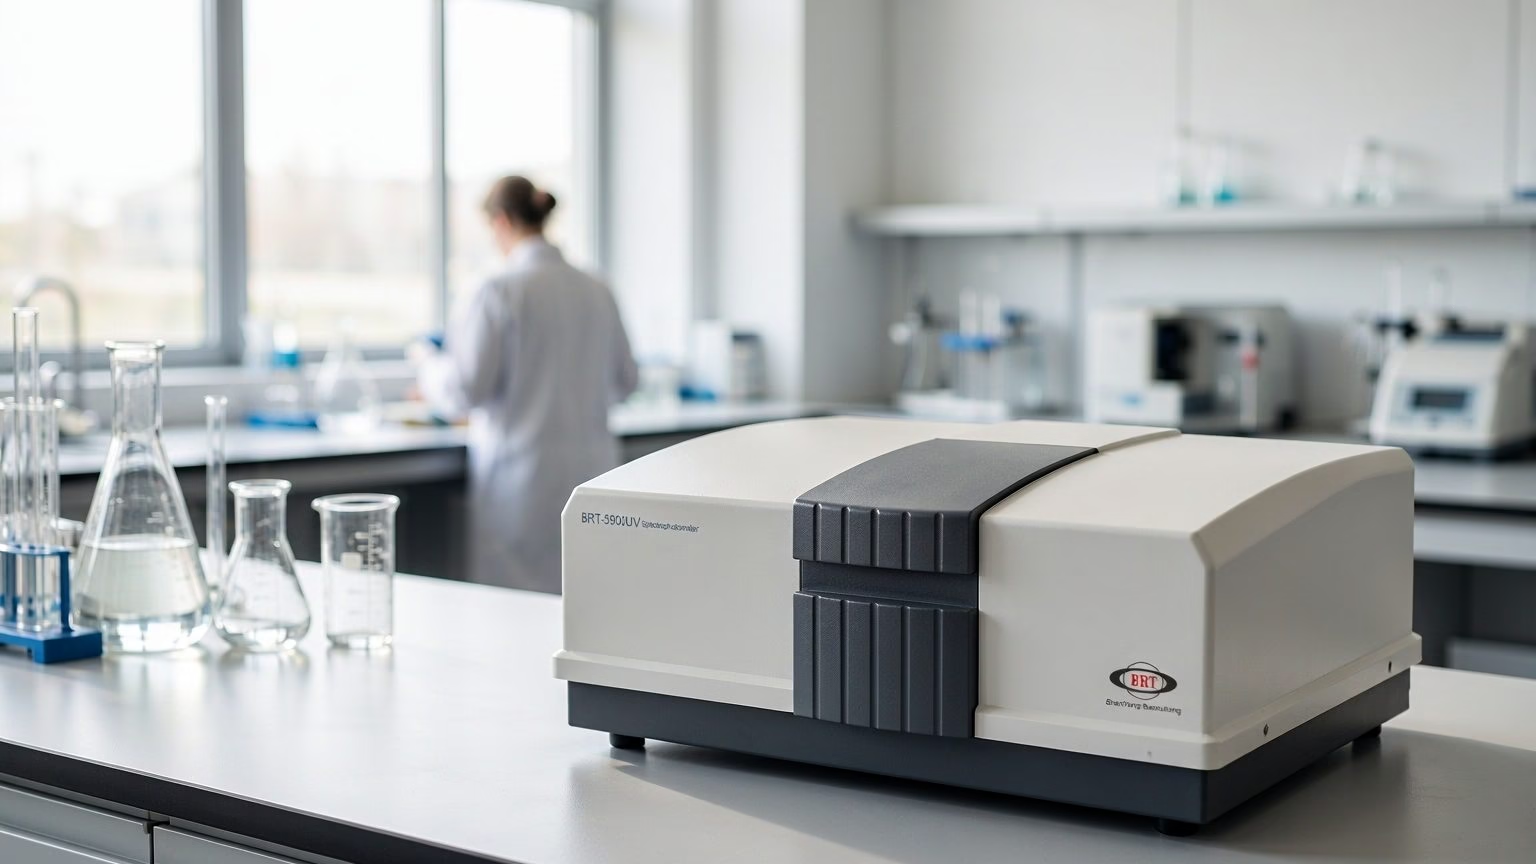
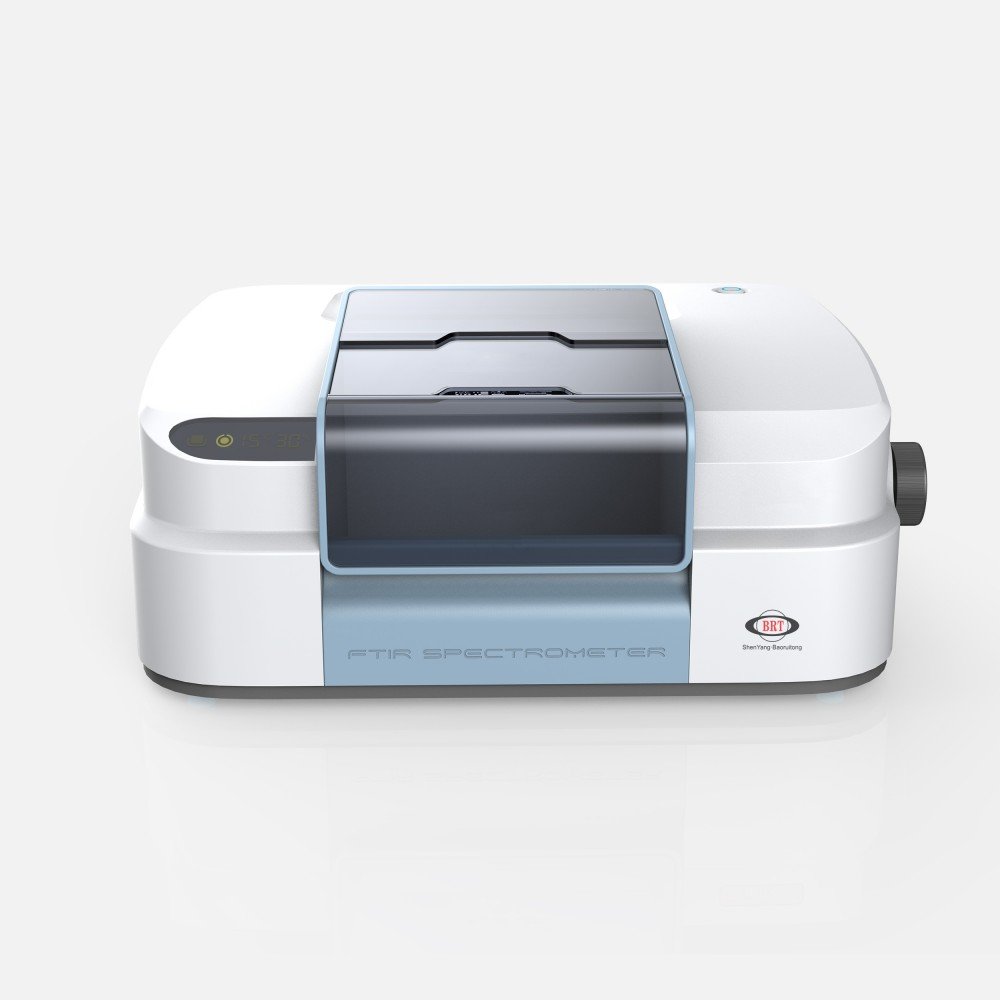
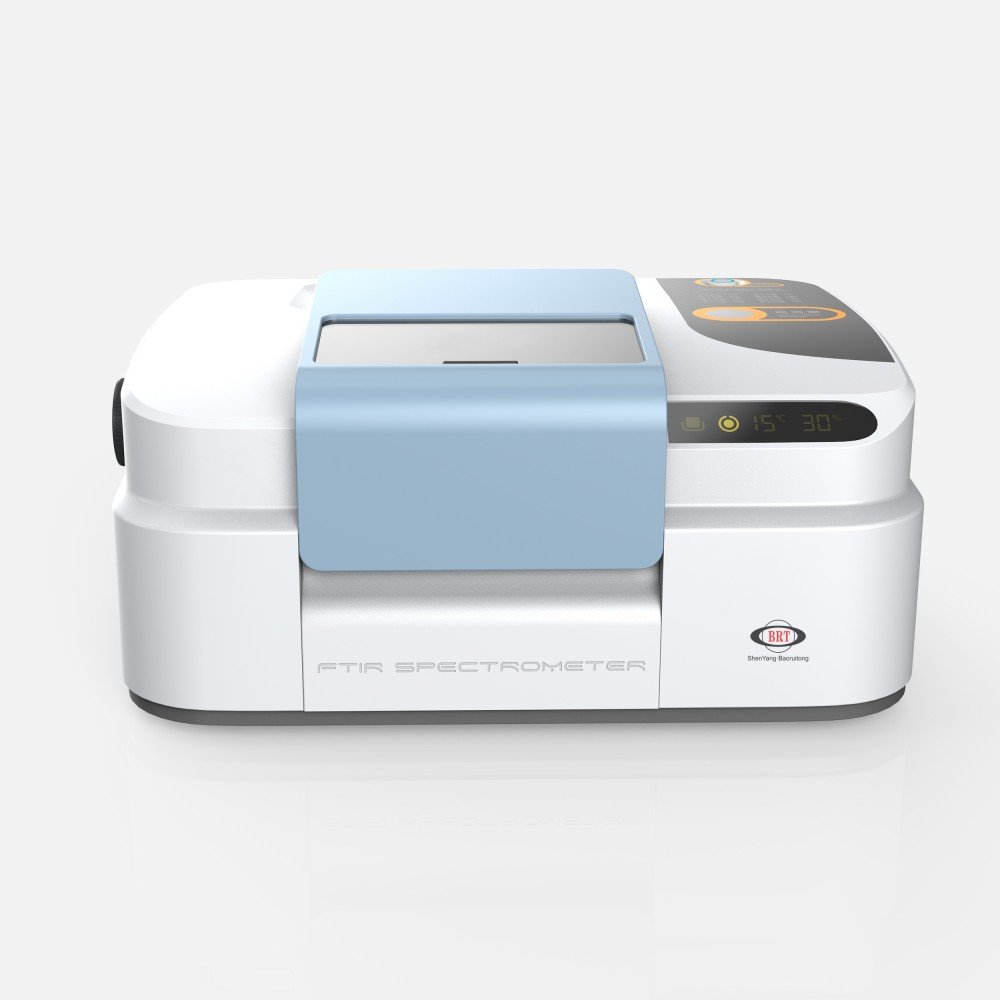
BRT Testing supplies an FTIR range for these programmes: the BRT-890 FTIR spectrometer, BRT-860 FTIR spectrometer, BRT-850 FTIR spectrometer and BRT-800 FTIR spectrometer.
Common Mistakes When Choosing Between Them
Treating them as interchangeable
The spectra are complementary because the selection rules differ [8]. A band intense in FTIR may be weak in Raman, and one result cannot be reported as the other. Specify the method your document requires.
Judging water or fluorescence by one sample
Water is harmless in Raman and difficult in FTIR [7]; fluorescence damages Raman and barely affects FTIR [7]. Test your own matrix, not a neat reference compound.
Ignoring the container
A sealed vial is convenient in Raman until glass masks the bands you need [10]. Quote container material and laser wavelength together; use quartz where background matters at 785 nm [10].
Buying on laser wavelength alone
A 785 nm laser reduces fluorescence but weakens signal since intensity scales with λ⁻⁴ [11]. A 532 nm system is a different compromise, not obsolete [9][11]. Match excitation to the sample set and budget for laser safety [12].
Forgetting calibration scope
ASTM E1421 excludes reflectance accessories, flow cells, FT-NIR and step-scan work [2], and NIST SRM 2241 has no 532 or 633 nm equivalent [6]. Confirm your verification artefact matches the configuration, and see our guide to how FTIR identifies unknown materials for context.
Frequently Asked Questions
What is the main difference between FTIR and Raman spectroscopy?
FTIR measures the absorption of infrared light as molecular vibrations change a molecule’s dipole moment, while Raman measures inelastically scattered laser light whose energy shifts when a vibration changes polarizability. Because the selection rules differ, FTIR is strong on polar groups such as O–H and Raman is strong on homonuclear bonds such as C–C and C=C. FTIR suits fluorescent samples; Raman suits aqueous samples and through-container checks.
Which technique is better for aqueous samples?
Raman is usually better for aqueous samples because water produces a very weak Raman signal and is largely disregarded, so the solute spectrum comes through with little interference. FTIR measures absorption, and water absorbs strongly across the infrared, which can dominate the spectrum and obscure the analyte. That is why Raman is often chosen for solutions, formulations and biological material, provided fluorescence from the matrix does not overwhelm the weaker scattering signal.
Why does fluorescence interfere with Raman but not FTIR?
Raman signals are intrinsically weak, so a fluorescent background generated by coloured samples or impurities during laser illumination can easily obscure the shifted spectral fingerprint. FTIR does not rely on laser-excited scattering and is essentially unaffected by that fluorescence, which makes it the better route for fluorescent or strongly coloured material. Switching a Raman laser toward near-IR or UV wavelengths can reduce fluorescence, but cannot guarantee a clean spectrum for every sample.
Can Raman measure through glass or plastic containers?
Yes. Because Raman is a non-contact optical technique, it can be focused through transparent or translucent containers and vials, which supports point-and-shoot checks of sealed samples and reduces preparation and contamination risk. The container is not invisible, however: ordinary glass can mask Raman bands, and quartz gives a lower background at 785 nm. Validate the exact container and wavelength combination before trusting a through-container identity or quantitative result.
What does a 785 nm laser change in a Raman measurement?
A 785 nm laser moves the excitation into the near-IR, where fluorescent backgrounds are usually weaker than with visible 532 or 633 nm excitation, so more samples give a usable fingerprint. The trade-off is sensitivity: Raman intensity scales roughly with the inverse fourth power of wavelength, so the longer wavelength gives a weaker signal and a slightly larger focused spot. It is the common compromise for fluorescent or coloured samples.
How do I calibrate the wavenumber scale of each instrument?
For FTIR, verify the wavenumber scale with a traceable polystyrene film such as NIST SRM 1921b, which certifies thirteen centroid bands between 544.92 and 3082.22 cm−1, and check instrument performance against a document such as ASTM E1421. For Raman, use a shift standard such as ASTM E1840 guide values and an intensity-corrected reference such as NIST SRM 2241 at 785 nm; the latter certifies 200–3500 cm−1 and has no 532 or 633 nm equivalent.
Do FTIR and Raman give the same information about polymers?
No. They probe the same molecule through different selection rules, so each emphasises different vibrations and the two spectra are complementary rather than interchangeable. Raman is strong on the carbon backbone and can distinguish C–C, C=C and C≡C bonds, while FTIR is more sensitive to polar side groups and additives. For polymer identification, use FTIR as the routine library method and add Raman when you need non-contact, through-container or water-tolerant measurements.
Conclusion: A Five-Step Selection Order
For FTIR vs Raman spectroscopy, choose the method in this order. First, fix the physical question: dipole-sensitive polar groups point to FTIR, polarizability-sensitive homonuclear bonds to Raman. Second, screen the matrix — fluorescent samples favour FTIR, aqueous samples favour Raman. Third, decide whether the measurement must be non-contact or through a container and validate the glass at the chosen wavelength. Fourth, choose excitation: near-IR around 785 nm suppresses fluorescence at the cost of signal, with laser safety built in. Fifth, confirm verification tools exist for that configuration — a polystyrene film and performance level for FTIR, shift values and an intensity standard for Raman.
The techniques answer different questions, so the right specification often includes both. Tell BRT Testing which samples you measure and which standard you must meet, and we will match the FTIR configuration to the method.
About the Author
Written by the BRT Testing content team — Shenyang Baoruitong Automation Equipment Co., Ltd., a manufacturer of FTIR spectrometers and laboratory analysis instruments. This guide is for laboratory managers, analytical chemists and procurement staff comparing spectroscopic methods.
Sources
- ASTM International — E1252-98(2021), general infrared techniques. https://store.astm.org/e1252.html
- ASTM International — E1421-99(2021), FT-MIR performance levels. https://store.astm.org/e1421.html
- ASTM International — E1840-96(2022), Raman shift calibration values. https://store.astm.org/e1840.html
- IEC — IEC 61207-6:2014 preview, FTIR and Raman definitions. https://cdn.standards.iteh.ai/samples/20437/d27b1a42e1384fa3995f2f4e4e0bb42b/IEC-61207-6-2014.pdf
- NIST — SRM 1921b certificate, polystyrene film. https://tsapps.nist.gov/srmext/certificates/1921b.pdf
- NIST — SRM 2241 certificate, Raman intensity correction. https://tsapps.nist.gov/srmext/certificates/2241.pdf
- Thermo Fisher Scientific — Technical Note 101b, Raman and FTIR. https://documents.thermofisher.com/TFS-Assets/CAD/Application-Notes/Raman-FTIR-TechNote-Final.pdf
- Renishaw — Why we use Raman spectroscopy. https://www.renishaw.com/en/why-we-use-raman-spectroscopy–25803
- Renishaw — Lasers and gratings. https://www.renishaw.com/en/lasers-and-gratings–25938
- Renishaw — Overcoming the limitations of Raman spectroscopy. https://www.renishaw.com/en/overcoming-the-limitations-of-raman-spectroscopy–25811
- HORIBA — Raman FAQ, UV Raman. https://www.horiba.com/scientific/products/raman-spectroscopy/raman-academy/raman-faqs/uv-raman/
- IEC — IEC 60825-1:2014 Ed 3.0, laser safety. https://webstore.iec.ch/en/publication/3587
- ISO — ISO 23978:2020, natural gas by laser Raman spectroscopy. https://committee.iso.org/en/standard/77518.html
- ASTM International — D7940-21, LNG by fiber-coupled Raman. https://store.astm.org/d7940.html