The Short Answer
A UV-Vis spectrophotometer for chemical analysis does not measure concentration; it measures transmittance, and everything that turns that into a defensible number is your method’s responsibility. The instrument gives you an absorbance at a wavelength. The Beer-Lambert relationship then converts that absorbance into a concentration through the molar absorption coefficient ε, the optical path length b, and the analyte concentration c, in the form A = εbc 1. Three things routinely go wrong in that chain, and none of them are instrument faults. First, ε is not a constant of nature: OIML R 135 states directly that the specific molar absorption coefficient e slightly depends on the amount of substance concentration c 2. Second, the path length is a variable you control with the cuvette, not the instrument. Third, the sample matrix can absorb on its own, and the fix is a calibration strategy, not a better instrument.
The Chain from Transmittance to Concentration
The definitions, and what they assume
ISO 6286:1982, Molecular absorption spectrometry — Vocabulary, fixes the terms, and OIML R 135 reproduces them: absorbance is the logarithm to base ten of the reciprocal of the transmittance, the optical path length b is the distance covered by the radiation flux between the entry and exit surfaces of a solution contained in an optical cell, and the specific molar absorption coefficient is the absorbance divided by b and the amount of substance concentration c, commonly expressed in L mol⁻¹ cm⁻¹ [1][2]. Older literature calls ε the extinction coefficient or molar absorptivity; the ISO term is molar absorption coefficient, and a method report should fix one term and use it consistently.
Why ε is not a constant
The note that matters most comes from OIML R 135: the specific molar absorption coefficient e slightly depends on the amount of substance concentration c [2]. A laboratory that treats ε as a book constant and expects a straight line through the origin is making an assumption the standard explicitly flags as approximate. For a defensible method, determine ε from your own standards on your own instrument rather than importing a literature figure whose uncertainty you do not know.
The validity conditions are not optional
OIML R 135 also sets the conditions for validity of the Beer-Lambert relationship: a beam of parallel monochromatic radiation traverses, at normal incidence, an absorbing medium with plane-parallel surfaces and which is homogeneous, isotropic, non-luminescent and non-scattering [2]. Turbid samples, emulsions and fluorescing species are not Beer-Lambert problems, and no amount of calibration will repair them.
Where the linearity actually ends
NIST is blunt about the upper end: at an absorbance of 3, only 0.1 % of the incident light reaches the detector, potentially leading to serious signal-to-noise issues, and shorter pathlengths help keep absorbance values in the optimal range for measurements, which NIST puts at 0.6 absorbance unit 3.
| Region of the absorbance range | What happens | Response |
|---|---|---|
| Very low absorbance | The signal is dominated by stray light and noise rather than by the analyte | Raise the analyte’s absorptivity or concentrate; do not just average longer |
| Mid range, around 0.6 AU | The regime NIST identifies as optimal for measurement [3] | Dilute or concentrate to land here |
| High absorbance | At A = 3 only 0.1 % of the incident light reaches the detector [3] | Shorten the path length or dilute |
| Above the working range | ASTM E925 states a working absorbance range of 0 to 2 for routine tests 4 | Re-prepare at a different concentration |
Calibration: The Decision That Sets the Method’s Validity
Five calibration strategies, and when each applies
ISO 8466-1:2021 is the ISO standard for calibration of spectrophotometric analysis, and Eurachem’s method validation guide sets out the same family of approaches in plain terms 5 14.
| Strategy | What it does | Use it when |
|---|---|---|
| One-point calibration | A single standard sets the scale | The response passes through zero and the standard is traceable |
| Two-point calibration | Two standards define the slope | The response is linear but has a non-zero intercept |
| Multi-point calibration | A set of standards defines the working curve | The routine case for a quantitative method |
| Standard addition | Known amounts of analyte are added to the sample at different levels and the analyte is determined by extrapolation 6 | The sample matrix contributes a background signal |
| Matrix-matched standards or internal standard | Standards are prepared in the sample matrix, or an internal standard compensates | The matrix varies from sample to sample |
Eurachem adds the governing requirement that, no matter which approach is applied, it should be proven that the response for the calibrators used truly represents the response for the authentic analyte in the sample matrix of interest [6]. Standard addition works because extrapolation holds the matrix constant across every calibration point, so it corrects a multiplicative matrix effect and does not correct an additive one.
What happens when the matrix absorbs on its own
Three failure modes need different remedies. An additive background is a near-constant absorption from the matrix, reagents or solvent; a reagent blank handles it, and it shifts the intercept rather than the slope. A multiplicative matrix effect changes the response factor itself, so the same analyte concentration gives a different signal in a different matrix — this is what standard addition is designed for [6]. Chemical interference, where matrix species react with the analyte or the reagent to form a different absorbing species, is not fixable by calibration; it needs a different method or a separation step.
Chromogenic Assays and Kinetic Methods
When the analyte needs a reaction
Many determinations are not direct: the analyte does not absorb usefully at a convenient wavelength, so the method creates a coloured derivative first. ISO 18724:2025 for dissolved chromium(VI) in water and the ISO 6332 and ISO 6333 series for iron and manganese are spectrophotometric methods built on a colour-forming reaction with a defined reagent and a defined reaction time 15. The reagent step therefore becomes part of the method: reagent concentration, pH, reaction time and temperature all appear in the validation as controlled variables, because each changes how much coloured product is present when the cuvette enters the instrument.
Kinetic methods measure a rate, not an endpoint
A kinetic method monitors the change of absorbance with time and uses the reaction rate to determine the concentration, which allows the measurement to be made before the reaction runs to completion — useful for unstable or fast reactions [2]. The cost is tight control of timing and temperature, because reaction rates are temperature-dependent.
Screening and quantifying are different claims
ISO 24421:2023 splits photometric work explicitly into qualitative and quantitative roles 7. A qualitative scan answers “is this the compound I think it is”; a quantitative method answers “how much, to a stated uncertainty”. A method that starts as a screen and gets used as a number without validation is the most common failure in routine work.
The Path Length Problem
In a UV-Vis spectrophotometer for chemical analysis, the cuvette is a variable, not a container. ASTM E169 treats the absorption cell path length as a controlled variable in UV-Vis quantitative analysis 13, and three practical consequences follow.
The same solution in two cuvettes gives two answers. If one cuvette is rated 10 mm and the actual path is 12 mm, the absorbance and the calculated concentration are both proportionally higher — and nothing in the spectrum looks wrong. The 1 cm standard is a convention, not a law. NIST puts the optimal absorbance at around 0.6 AU and recommends shorter pathlengths to hold a high-absorbance sample in that range [3]; path length can be traded against concentration. Cleanliness and window material are part of the method. A fingerprint, a bubble or a scratch changes the measured path or adds scattering; matched cuvettes handled by the optical faces are a method requirement, not housekeeping.
Where the Instrument Itself Ends
The parameters that have to be verified
ASTM E275 is the reference practice for describing and measuring the performance of ultraviolet and visible spectrophotometers, covering wavelength accuracy, photometric accuracy, stray light, resolution and absorption cell characteristics — while stating plainly that it is specifically not to be concluded that all the factors in instrument performance are measured, or in fact may be required, for a given application 8.
ASTM E925 covers the parameters critical for most routine tests within 200 nm to 700 nm and an absorbance range of 0 to 2, with illustrative tolerances of ±1 % relative on the absorbance scale over 0.2 to 2.0 and ±1.0 nm on the wavelength scale; a suggested maximum stray radiant power ratio of 4 × 10⁻⁴ yields less than 1 % absorbance bias at an absorbance of 2 [4]. At the top of the working range, then, stray light contributes about a 1 % bias — and at lower absorbances the same stray light contributes proportionally more, which is the mirror image of the high-absorbance problem and the reason low-absorbance results are unreliable 12.
Verifying with a certified reference material
The check that anchors the wavelength scale is the holmium oxide solution. NIST SRM 2034 is certified for wavelength accuracy from 240 to 650 nm at six spectral bandwidths from 0.1 to 3 nm, with an expanded uncertainty of about ±0.05 nm 9. The detail worth knowing is that the certified positions shift with bandwidth — band 9 moves from 416.02 nm at 0.1 nm bandwidth to 416.89 nm at 3 nm, and band 10 is not certified below 1 nm because it resolves into two minima [9]. A laboratory that assumes a fixed table of holmium peaks will read a systematic error out of a bandwidth change.
Our article on UV-Vis wavelength accuracy and stray light verification covers that check in detail, and the UV-Vis calibration guide covers the wider calibration programme.
Making the Method Defensible Under ISO/IEC 17025
ISO/IEC 17025:2017 is the reference for laboratory competence, impartiality and consistent operation 10. The clauses that matter for a quantitative UV-Vis method:
| Clause | What the laboratory must be able to show |
|---|---|
| 7.2.1 / 7.2.2 | That the method is validated for this analyte and matrix — specificity, linearity, range, accuracy, precision, robustness |
| 7.3 | How the sample was taken and prepared, and whether the matrix is representative |
| 7.6 | The uncertainty budget, and whether it affects conformity to a limit |
| 7.7 | How performance is monitored, including comparison with other laboratories |
| 7.8 | Report contents, including the uncertainty statement and the decision rule for conformity |
The uncertainty budget is where a method’s real weaknesses appear. A concentration from A = εbc carries the uncertainty of the absorbance reading, ε, the path length and the calibration; where ε comes from a literature value, its uncertainty is frequently the largest single term. JCGM 100:2008 (the GUM) is the framework for the budget, and Eurachem’s QUAM guide is the practical version for an analytical laboratory [11]16.

Frequently Asked Questions
What does a UV-Vis spectrophotometer actually measure in a chemical analysis?
It measures transmittance through the sample and reports it as an absorbance — the logarithm to base ten of the reciprocal of the transmittance [2]. Concentration is then calculated from A = εbc, using the molar absorption coefficient ε, the path length b and the concentration c [1]. The instrument supplies the absorbance; the method supplies everything else.
Is the molar absorption coefficient a constant you can look up?
Not exactly, and this is a common error. OIML R 135 states that the specific molar absorption coefficient e slightly depends on the amount of substance concentration c [2]. Older texts also use molar absorptivity and extinction coefficient for ε, which is why literature values differ in their stated units; ISO 6286 uses molar absorption coefficient [1]. For a defensible method, determine ε from your own standards on your own instrument.
How do I deal with a matrix that absorbs at the analyte wavelength?
Identify the interference type first. An additive background is handled by a reagent blank. A multiplicative matrix effect is what standard addition is for: known additions of analyte are made to the sample itself and the result is obtained by extrapolation, so the matrix stays constant across the calibration [6]. A chemical interference, where the matrix reacts with the analyte or the reagent, needs a different method or a separation — no calibration strategy repairs it.
Should I use a 10 mm cuvette for everything?
No; follow the absorbance rather than habit. NIST identifies around 0.6 absorbance unit as optimal, and at an absorbance of 3 only 0.1 % of the incident light reaches the detector [3]. A 10 mm cuvette is conventional because it makes the arithmetic familiar and path length can be traded against concentration. If the sample is too absorbing, use a shorter path or dilute; if too dilute, concentrate or use a more absorptive derivative.
What is the acceptable working absorbance range?
ASTM E925 covers routine tests within 200 nm to 700 nm and an absorbance range of 0 to 2, with illustrative tolerances of ±1 % relative on the absorbance scale over 0.2 to 2.0 and ±1.0 nm on the wavelength scale [4]. OIML R 135 likewise uses an absorbance measurement interval of 0 to 2 with a stray-light limit [2]. Working above that range is possible but no longer covered by these verification practices.
How much does stray light affect my result?
ASTM E925 calculates that a stray radiant power ratio of 4 × 10⁻⁴ yields less than 1 % absorbance bias at an absorbance of 2 [4]. At low absorbance the same stray light is a much larger fraction of the signal, which is the main reason low-absorbance results are unreliable — and why ASTM E387 and E275 treat stray light as a parameter to be verified, not assumed [8][12].
How do I validate a UV-Vis method for ISO/IEC 17025 purposes?
Under clause 7.2, confirm suitability in 7.2.1, then establish specificity, linearity, range, accuracy, precision and robustness in 7.2.2 for this analyte in this matrix. Then handle sampling under 7.3, build the uncertainty budget under 7.6, monitor performance under 7.7, and report under 7.8 with the decision rule. Eurachem’s fitness-for-purpose guide is the practical route through 7.2.2 [5].
Is a kinetic method better than an endpoint measurement?
Neither is better in general. A kinetic method uses the reaction rate, so the measurement can finish before the reaction does — the advantage for unstable or fast chemistry [2]. The cost is tighter timing and temperature control, since rates are temperature-dependent. Endpoint methods are simpler and more reproducible when the reaction completes cleanly.
Conclusion: The Order of Operations
A quantitative UV-Vis method is defensible when built in this order: define the measurand and matrix; check the Beer-Lambert validity conditions; land the working absorbance near 0.6 AU by adjusting concentration or path length; choose the calibration strategy from the matrix behaviour; fix the reagent variables for a chromogenic assay; verify the instrument against ASTM E275/E925 and the wavelength scale against a certified holmium reference such as NIST SRM 2034; build the uncertainty budget including ε and path length; report under clause 7.8 with the uncertainty and decision rule.
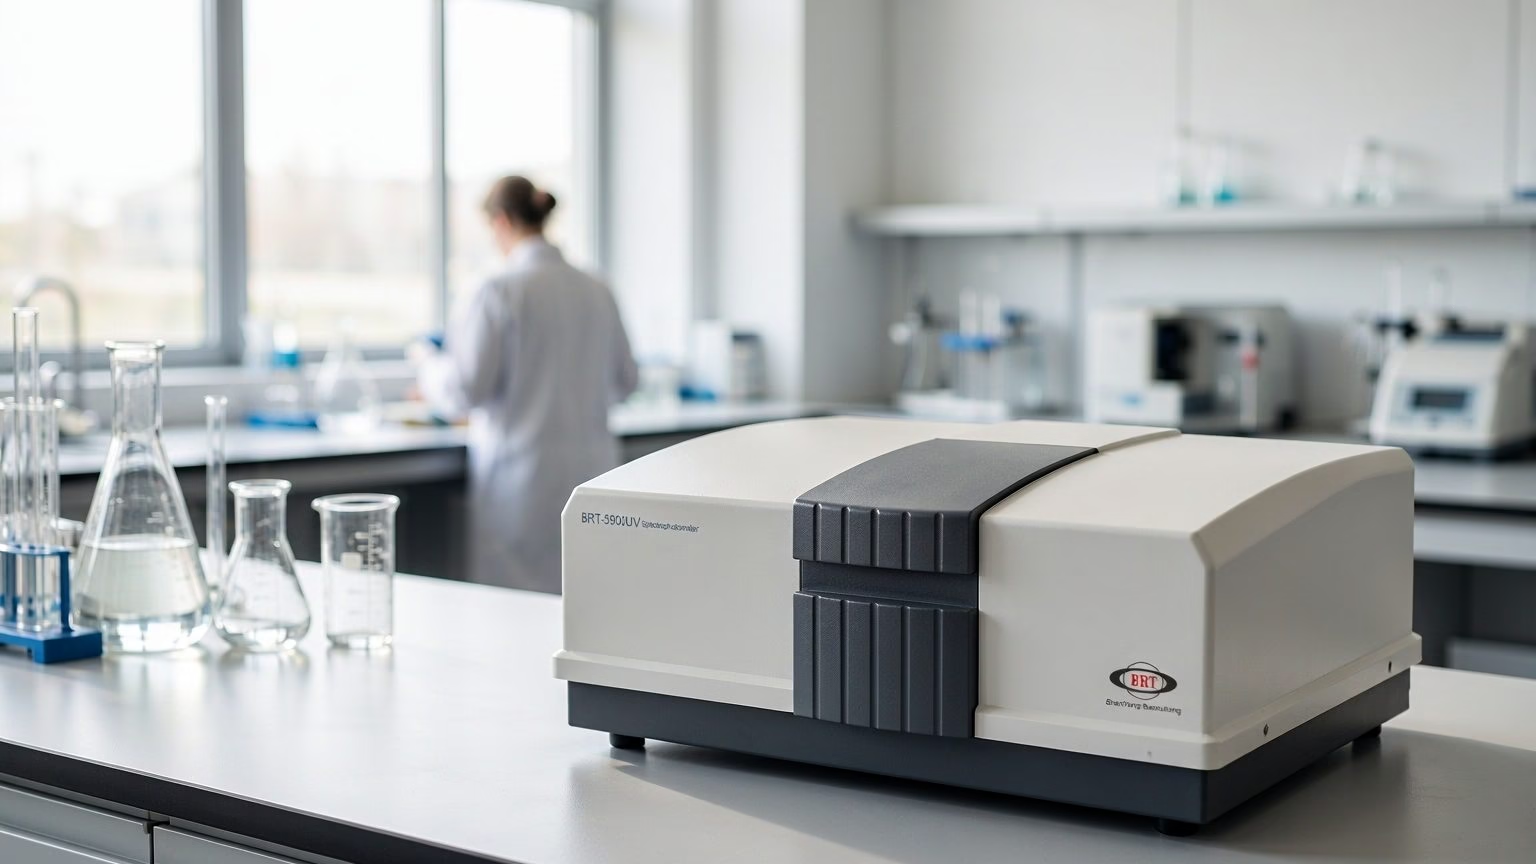
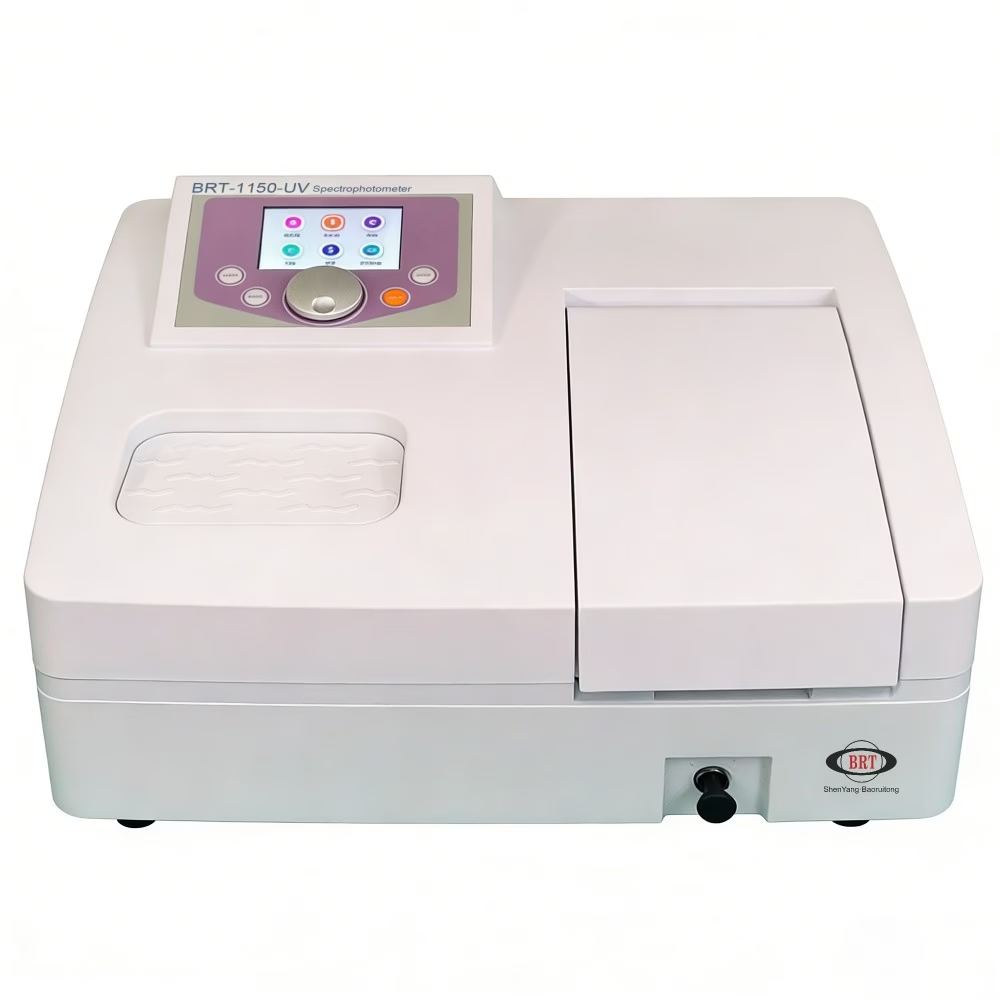
For the instrument side, BRT builds the BRT-6100UV UV-Vis spectrophotometer for quantitative work where matrix effects and drift matter, the BRT-1150UV UV-Vis spectrophotometer for double-beam routine analysis, and the BRT-5000UV high precision UV/Vis spectrophotometer where wavelength and photometric accuracy dominate the method. Tell us the analyte, the matrix, the concentration range and the samples per day, and we will map the instrument, the path length and the validation scheme to the method.
About the Author
Written by the BRT Testing content team — Shenyang Baoruitong Automation Equipment Co., Ltd., a manufacturer of fire and flame testing equipment and materials analysis instruments. This article is written for analytical chemists and laboratory managers who need UV-Vis concentrations that survive review.
Sources
- ISO / UNI — ISO 6286:1982, Molecular absorption spectrometry — Vocabulary (official store page). https://webstore.uni.com/en/iso-6286-1982
- OIML — OIML R 135:2004 (E), Spectrophotometers for medical laboratories (PDF, primary). https://www.oiml.org/en/publications/oiml-bulletin/2026-01/tc-sc-pg/en/files/pdf_r/r135-e04.pdf
- NIST — DeRose, Cole, Urbas, Choquette, Solis, Stein, Lang, He, NIST Spectroscopic Measurement Standards, published 1 May 2018 (official publication page). https://www.nist.gov/publications/nist-spectroscopic-measurement-standards
- ASTM International — ASTM E925, monitoring the calibration of UV-Vis spectrophotometers whose spectral bandwidth does not exceed 2 nm (official store page). https://store.astm.org/e925.html
- Eurachem — The Fitness for Purpose of Analytical Methods, third edition (2025). https://eurachem.org/index.php/publications/guides/mv
- Eurachem — The Fitness for Purpose of Analytical Methods, third edition (2025), calibration approaches including standard addition (PDF). https://eurachem.org/images/stories/Guides/pdf/MV_guide_3rd_ed_V1_EN.pdf
- ISO — ISO 24421:2023, photometric analysis for the determination of colour (official store page). https://webstore.uni.com/en/iso-24421-2023
- ASTM International — ASTM E275, describing and measuring performance of UV-Vis spectrophotometers (official store page). https://store.astm.org/e275.html
- NIST — SRM 2034 certificate of analysis, holmium oxide solution for wavelength accuracy (PDF, primary). https://tsapps.nist.gov/srmext/certificates/2034.pdf
- ISO / IEC — ISO/IEC 17025:2017, general requirements for the competence, impartiality and consistent operation of laboratories (official store page). https://webstore.uni.com/en/iso-iec-17025-2017
- BIPM — JCGM 100:2008, Evaluation of measurement data — Guide to the expression of uncertainty in measurement (GUM). https://www.bipm.org/documents/20126/2071204/JCGM_100_2008_E.pdf
- ASTM International — ASTM E387, stray radiant power ratio by the opaque filter method (official store page). https://store.astm.org/e387.html
- ASTM International — ASTM E169, UV-Vis quantitative analysis (official store page). https://store.astm.org/e169.html
- ISO — ISO 8466-1:2021, calibration of spectrophotometric analysis (official store page). https://webstore.uni.com/en/iso-8466-1-2021
- CEN / UNI — ISO 18724:2025, determination of dissolved chromium(VI) in water (official store page). https://webstore.uni.com/en/iso-18724-2025
- Eurachem / CITAC — Quantifying Uncertainty in Analytical Measurement, third edition (2012). https://eurachem.org/images/stories/Guides/pdf/QUAM2012_P1.pdf
- ISO / IEC — ISO/IEC 17025:2017 official preview, clause structure (PDF, primary). https://cdn.standards.iteh.ai/samples/66912/47063b25710044d7a9523b36b0258047/ISO-IEC-17025-2017.pdf