The Short Answer
A spectrophotometer vs colorimeter decision should start from the question you need answered: a colorimeter reads three numbers that match one human observer under one illuminant, while a UV-Vis spectrophotometer records the full spectrum — and only the spectrum can explain a colour, expose metamerism, or do quantitative analysis beyond colour. If your workflow is pass/fail colour matching of similar, opaque, non-fluorescent samples, a colorimeter is faster and cheaper. If samples vary in texture or finish, if metamerism or fluorescence is in play, if you need to trace a cause or measure concentration at a wavelength, the spectrophotometer is the instrument that survives contact with real samples 1.
The Core Difference: A Spectrum Versus Three Numbers
What a colorimeter measures
A colorimeter shines a light on (or through) the sample and reads the response through a small number of broad filters engineered to mimic the CIE standard observer. Its output is tristimulus data — effectively three integrated numbers that sit inside the CIE colorimetry framework 5. That design is deliberate: for industrial colour control, the colour difference ΔE between a batch and a standard is what the operator acts on, and the filter-response route computes it directly and quickly. ASTM D2244 codifies exactly this workflow — instrumentally measured color coordinates converted into colour tolerances and colour differences 3. When the sample population is well-behaved — same material family, similar texture, no fluorescence — the colorimeter’s answer is the one the workflow needs, at a fraction of the cost and complexity.
What a UV-Vis spectrophotometer adds
A spectrophotometer measures how much light the sample reflects or transmits at each wavelength across its range, producing the spectrum rather than a filtered integral. Measuring that spectral data for object-colour evaluation is the subject of ASTM E1164 [1], and ASTM E308 specifies how to compute CIE tristimulus values from the measured spectrum 2. Because the underlying data is spectral, everything else is downstream and reversible: you can recompute tristimulus values under a different illuminant, under a different observer angle, or after correcting for a fluorescent whitening agent — none of which a filter instrument can re-derive, because its integration already threw the spectral detail away. The spectrum also carries non-colour information: absorbance versus wavelength is the working quantity for concentration measurement, reaction kinetics and impurity identification, which is the entire other half of a UV-Vis laboratory’s work. How that works is covered in our absorbance measurement guide.
What Each Instrument Can and Cannot Tell You
| Question | Colorimeter | UV-Vis spectrophotometer |
|---|---|---|
| Does this batch match the standard within ΔE? | Yes — direct readout, fastest route [3] | Yes, after computing coordinates from the spectrum [2] |
| Is the match metameric (matches here, not there)? | Cannot see it | Visible in the spectral curve [1] |
| Does the sample fluoresce, and how much? | Reads the result, cannot separate it | Separates excitation and emission effects in the spectrum |
| Why did the colour drift (which wavelengths)? | Not answerable | The spectral difference is the diagnosis |
| Concentration of a dissolved analyte | No | Yes — absorbance vs concentration at a fixed wavelength |
| Whiteness / yellowness indices | Direct readout in many models 4 | Computed from the spectrum [4] |
| Texture- or gloss-sensitive samples | High risk of false differences | Spectral data supports the geometry-aware analysis |
The Standards Behind Each Route
The object-colour framework splits cleanly between the two instruments, and the ASTM documents make the split explicit:
| Document | What it governs | Which instrument it assumes |
|---|---|---|
| ASTM E1164 [1] | Obtaining spectrometric data for object-colour evaluation | Spectrophotometer |
| ASTM E308 [2] | Computing the colors of objects using the CIE system from observed spectral data | Spectrophotometer |
| ASTM D2244 [3] | Calculation of color tolerances and color differences from instrumentally measured color coordinates | Either, from coordinates |
| ASTM E313 [4] | Calculating yellowness and whiteness indices from instrumentally measured color coordinates | Either, from coordinates |
| CIE 015: Colorimetry, 4th edition [5] | The underlying standard observer and illuminant framework | Both |
The practical reading: a colorimeter can satisfy D2244 and E313 because those practices consume coordinates. E1164 and E308, the documents that generate and use spectral data, are only reachable with a spectrophotometer [1][2]. If a customer specification cites E1164, the instrument choice has already been made for you.
Where Metamerism and Fluorescence Break a Colorimeter
Two sample behaviours produce the classic colorimeter failures, and both are spectral phenomena.
Metamerism: the match that depends on the light
Metamerism occurs when two samples match under one illuminant but not another, because their spectra differ even though their tristimulus values coincide under the first illuminant. A colorimeter that integrated under a single illuminant reports a match; a spectrophotometer reveals the spectral difference that predicts the mismatch under the second illuminant [1][5]. For supply chains that ship materials into different lighting environments — retail floors, daylight, warehouse lighting — this is the difference between a batch that passes QC and a complaint in the field.
Fluorescence: when the sample adds light of its own
Fluorescence occurs when the sample absorbs excitation light and re-emits at longer wavelengths, adding light to the measured signal. Whitening agents in paper and textiles make this routine rather than exotic. A filter instrument cannot separate the re-emitted light from the reflected light, so the reported colour silently depends on the instrument’s light source. A spectrophotometer’s spectral record supports the separation — and where the application demands it, dedicated fluorescence measurement configurations exist — which is why paper, textile and plastics labs with optical brighteners standardise on spectrophotometers.
Measurement Geometry: The Detail Most Comparisons Miss
Both instrument families come in different measurement geometries — the physical arrangement of illumination and viewing relative to the sample — and the geometry decides how much of the surface’s gloss and texture enters the reading. Directional geometries (illumination and viewing at fixed angles, such as forty-five degrees and zero) exclude most of the specular reflection, so they read what a person sees when looking straight at the surface, texture and all; diffuse geometries collect the hemispherical reflectance with an integrating sphere and can include or exclude the specular component by design. The same sample can read differently under each, so a batch comparison between instruments of different geometries is not a like-for-like measurement.
The practical rule is simply to match: whatever geometry the customer specification, the product standard or the reference data assumes, the instrument must use the same one, and mixed fleets should standardise where disputes matter. This is also one more place where the spectrophotometer’s flexibility pays off — a spectral instrument configured for one geometry can at least document its conditions, while a filter instrument’s geometry is fixed at purchase. ASTM E1164, which governs spectrometric object-colour data, exists precisely to pin these conditions down in a citable way [1].
Matching the Instrument to the Job
| Application | Decisive requirement | Better fit |
|---|---|---|
| Incoming QC of pigments, paints, plastics parts against a standard | Fast ΔE vs standard on similar samples | Colorimeter |
| Multi-supplier sourcing with mixed finishes and textures | Diagnosing why a batch differs | UV-Vis spectrophotometer |
| Paper and textiles with optical brighteners | Separating fluorescence from reflectance | UV-Vis spectrophotometer |
| Whiteness / yellowness reporting only | Direct index readout | Colorimeter (E313 workflow) [4] |
| Dissolved analyte concentration, kinetics, purity checks | Absorbance spectrum at defined wavelengths | UV-Vis spectrophotometer |
| Certifying to a specification that cites E1164 | Spectrometric data | UV-Vis spectrophotometer [1] |
Reading the Specification Sheet: What Actually Differs
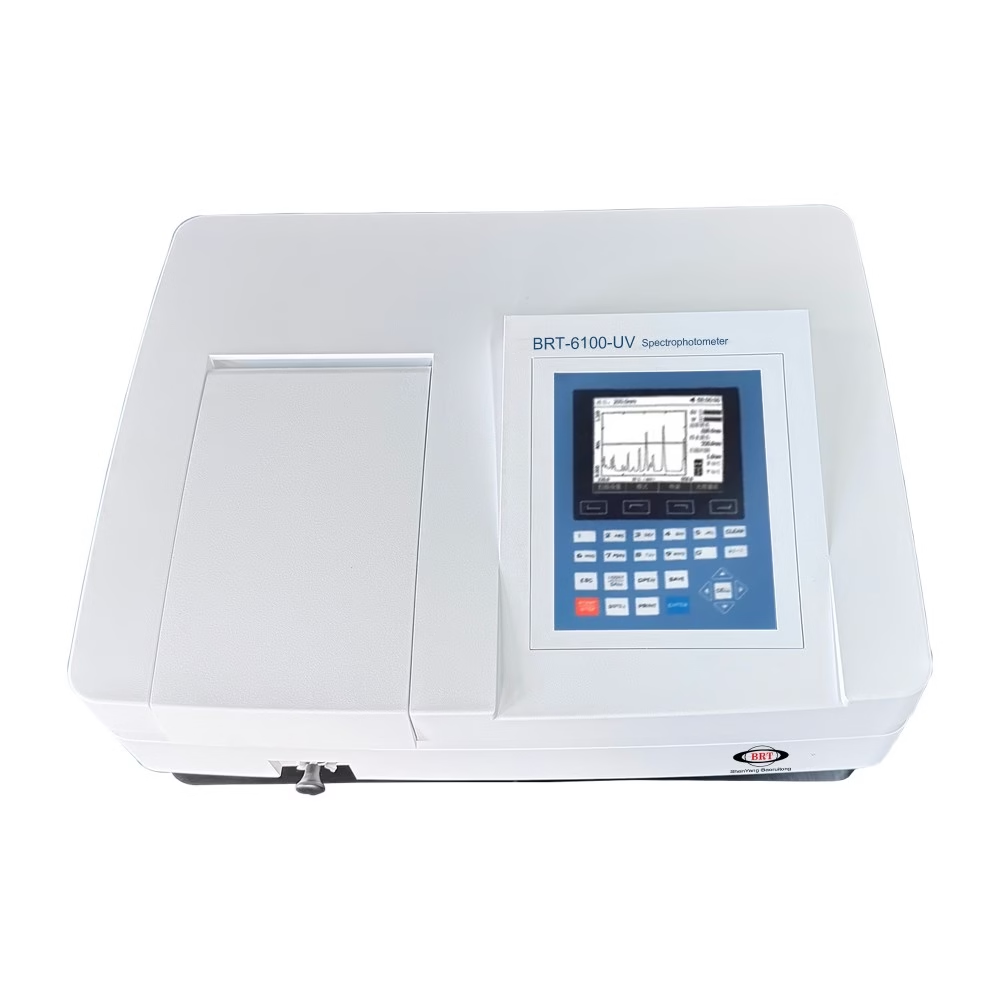
Because the two instrument types share a catalogue vocabulary, it helps to know which specification lines carry weight in the spectrophotometer vs colorimeter decision. Wavelength range decides what the spectrophotometer can see: a range covering the ultraviolet region captures absorbers that the visible-only region misses, which matters for optical brighteners and for analytes absorbing below 400 nm. Spectral bandwidth (or resolution) decides how finely the spectrum is resolved — narrow bandwidth separates close-lying absorption bands, which is decisive for laboratory analysis work rather than colour reporting. Photometric range and stray light decide how far into high-absorbance samples the instrument still reads accurately, and stray light is the classic hidden error in concentrated solutions — our guide to wavelength accuracy and stray light verification covers how laboratories check both. Data interval decides how many points describe the curve; colour work tolerates coarse intervals, but kinetic and purity work does not.
A colorimeter’s specification sheet is shorter by design: the meaningful lines are its geometry, its filter set relative to the standard observer, its repeatability and its inter-instrument agreement — the last two deciding whether two colorimeters on two production lines read the same batch the same way. That inter-instrument agreement question is the colorimeter’s equivalent of a spectrophotometer’s calibration discipline, and it is where cheap units quietly cost more than they appear to.
When the Answer Needs the Full Spectrum — and What to Buy
The comparison is not a ranking: it is two instruments answering different classes of question. A colorimeter answers “does this match” quickly and cheaply when the sample world is narrow. A UV-Vis spectrophotometer answers the same question and carries the diagnostic, metameric, fluorescent and quantitative workloads, at a higher purchase price and with more to maintain. A pragmatic pattern in many quality laboratories is both: colorimeters at the line for pass/fail, one spectrophotometer at the lab for disputes, investigations and the concentration work that colour instruments cannot do at all.
A short walkthrough shows the logic working. A paint plant controls batch colour against an in-house standard: same chemistry family, same finish, one production hall, one illuminant — the colorimeter answers the only question asked, and it answers it in seconds. Add a second supply site with different resin lots, and spectral differences between lots that match under the hall’s lighting begin to surface as complaints under daylight: the question has grown a spectral component, and the colorimeter cannot see it. Add an optical brightener to the formulation, and even the colour question becomes instrument-dependent. The instrument that survives each widening of the question is always the spectrophotometer — which is why the spectrophotometer vs colorimeter decision should start from the widest question the laboratory realistically answers in the next few years, not from today’s narrowest one.
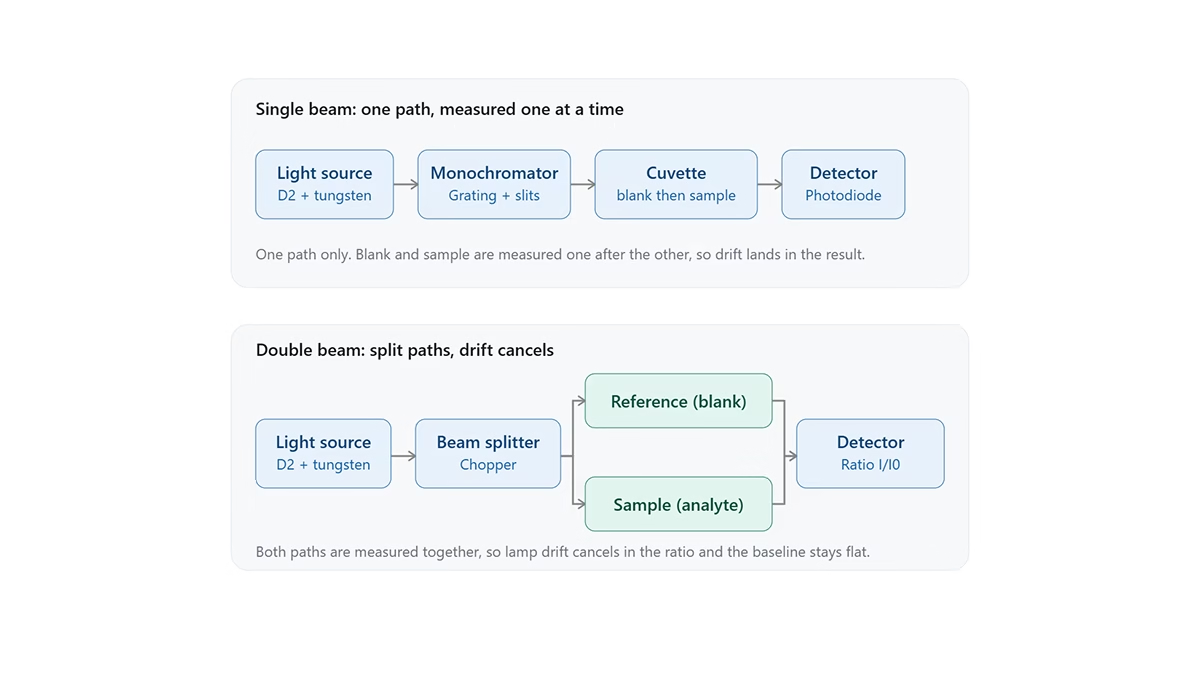
If the spectral route is the one you need, our UV-Vis spectrophotometer buying guide walks the selection parameters, the single beam vs double beam comparison covers the optical architecture that decides drift behaviour, and our FTIR vs UV-Vis comparison maps where molecular spectroscopy takes over from UV-Vis entirely. For instrument specifics, the BRT-6100UV and BRT-5900UV pages list the wavelength range, bandwidth and data-processing features relevant to colour and concentration work.
Calibration and Maintenance: What Each Route Demands
Both instruments drift, and the maintenance disciplines differ in kind. A colorimeter’s world is calibration tiles: a set of certified colour standards, measured periodically, with drift against the tile values flagging lamp ageing or filter degradation. Repeatability and tile agreement are the whole health check, and the procedure is short enough to sit at the top of a shift. A UV-Vis spectrophotometer’s health check is broader: wavelength accuracy verified against certified reference materials with known absorption bands, photometric accuracy against neutral-density standards, stray light against cut-off filters, and baseline flatness — a discipline set our UV-Vis calibration guide walks through in detail. The lamps themselves age: source replacement is a scheduled event on a spectrophotometer in a way it is not on a filter instrument.
Budget for this asymmetry when comparing total cost of ownership. The colorimeter’s purchase price advantage survives in laboratories whose accuracy requirement is a repeatable ΔE; the spectrophotometer’s overheads buy the verifiable accuracy chain that regulated and diagnostic work demands. Neither list is hidden — both are in the manufacturer’s documentation — but only one of them scales with the accuracy you promise your customers.
Frequently Asked Questions
What is the main difference between a spectrophotometer and a colorimeter?
A colorimeter reads the sample response through a few broadband filters that approximate the CIE standard observer, outputting three tristimulus numbers. A UV-Vis spectrophotometer measures reflectance or transmittance wavelength by wavelength, outputting the full spectrum. Coordinates can be computed from a spectrum, but a spectrum cannot be recovered from filter outputs — which is why spectrophotometers can explain colour behaviour and colorimeters can only score it.
When is a colorimeter enough?
A colorimeter is enough for routine pass/fail colour control when samples belong to the same material family, have similar surface texture, contain no fluorescent agents, and the comparison illuminant is fixed. In that narrow world the ΔE readout against a standard is exactly the decision the operator makes, and ASTM D2244 formalises the tolerance workflow. Outside that world, a colorimeter’s three numbers start hiding what is really happening.
Why do metameric samples fool a colorimeter?
Metameric samples share tristimulus values under one illuminant but differ spectrally, so they match under that illuminant and diverge under others. A colorimeter integrates through its filters under one light source and reports a match, with no record of the underlying curve. A spectrophotometer records the spectral difference directly, which is what predicts the mismatch under a different illuminant.
Can a colorimeter measure fluorescence?
It measures the fluorescent sample, but it cannot separate the re-emitted light from reflected light, so the reading silently depends on the instrument’s light source and filter set. That makes results instrument-dependent and hard to defend across vendors. A spectrophotometer’s wavelength-resolved data supports the separation, which is why optical-brightener applications in paper and textiles standardise on spectrophotometers.
Which ASTM standards apply to object colour measurement?
The framework is ASTM E1164 for obtaining spectrometric data, ASTM E308 for computing CIE colors from that data, ASTM D2244 for colour tolerances and differences from measured coordinates, and ASTM E313 for yellowness and whiteness indices. E1164 and E308 presuppose a spectrophotometer; D2244 and E313 consume coordinates either instrument can produce. The CIE Colorimetry publication underlies the observer and illuminant definitions.
Can a spectrophotometer do what a colorimeter does?
Yes — compute tristimulus values, colour differences and indices from the measured spectrum using the ASTM E308, D2244 and E313 workflows. The reverse is not true. The trade-off is cost, speed and simplicity: for high-throughput pass/fail on well-behaved samples, the colorimeter remains the economical choice, and many laboratories run both.
Do I need a UV-Vis spectrophotometer if colour is not my job?
If you measure concentration, kinetics or purity of dissolved substances, yes — absorbance versus wavelength is the working quantity, and that is a spectrophotometer’s native measurement regardless of colour work. Colour instruments have no absorbance-analysis capability. Our absorbance measurement guide explains how the measurement is set up and what instrument parameters control its accuracy.
Sources
- ASTM International — E1164 Standard Practice for Obtaining Spectrometric Data for Object-Color Evaluation. https://store.astm.org/e1164.html
- ASTM International — E308 Standard Practice for Computing the Colors of Objects by Using the CIE System. https://store.astm.org/e308.html
- ASTM International — D2244 Standard Practice for Calculation of Color Tolerances and Color Differences from Instrumentally Measured Color Coordinates. https://store.astm.org/d2244.html
- ASTM International — E313 Standard Practice for Calculating Yellowness and Whiteness Indices from Instrumentally Measured Color Coordinates. https://store.astm.org/e313.html
- CIE — CIE 015: Colorimetry, 4th edition (2018). https://cie.co.at/publications/colorimetry-4th-edition