The Short Answer
UV-Vis spectroscopy in pharmaceutical testing survives because it is fast, cheap per test and easy to validate — and it still owns dissolution and content uniformity in plants where an HPLC queue would be a bottleneck. Four applications carry most of the work: assay of a single active in a simple matrix, dissolution profiling in a flow cell, uniformity of dosage units, and identity or limit tests at a specified wavelength. What separates a compliant laboratory from a busy one is not the instrument but the evidence around it: wavelength and photometric verification against a certified reference material, a validated method built to the Q2(R2) framework 1, and records that satisfy 21 CFR 211 4. The failures that show up in inspections are almost always document failures, not optical ones.
Where UV-Vis Still Owns the Method
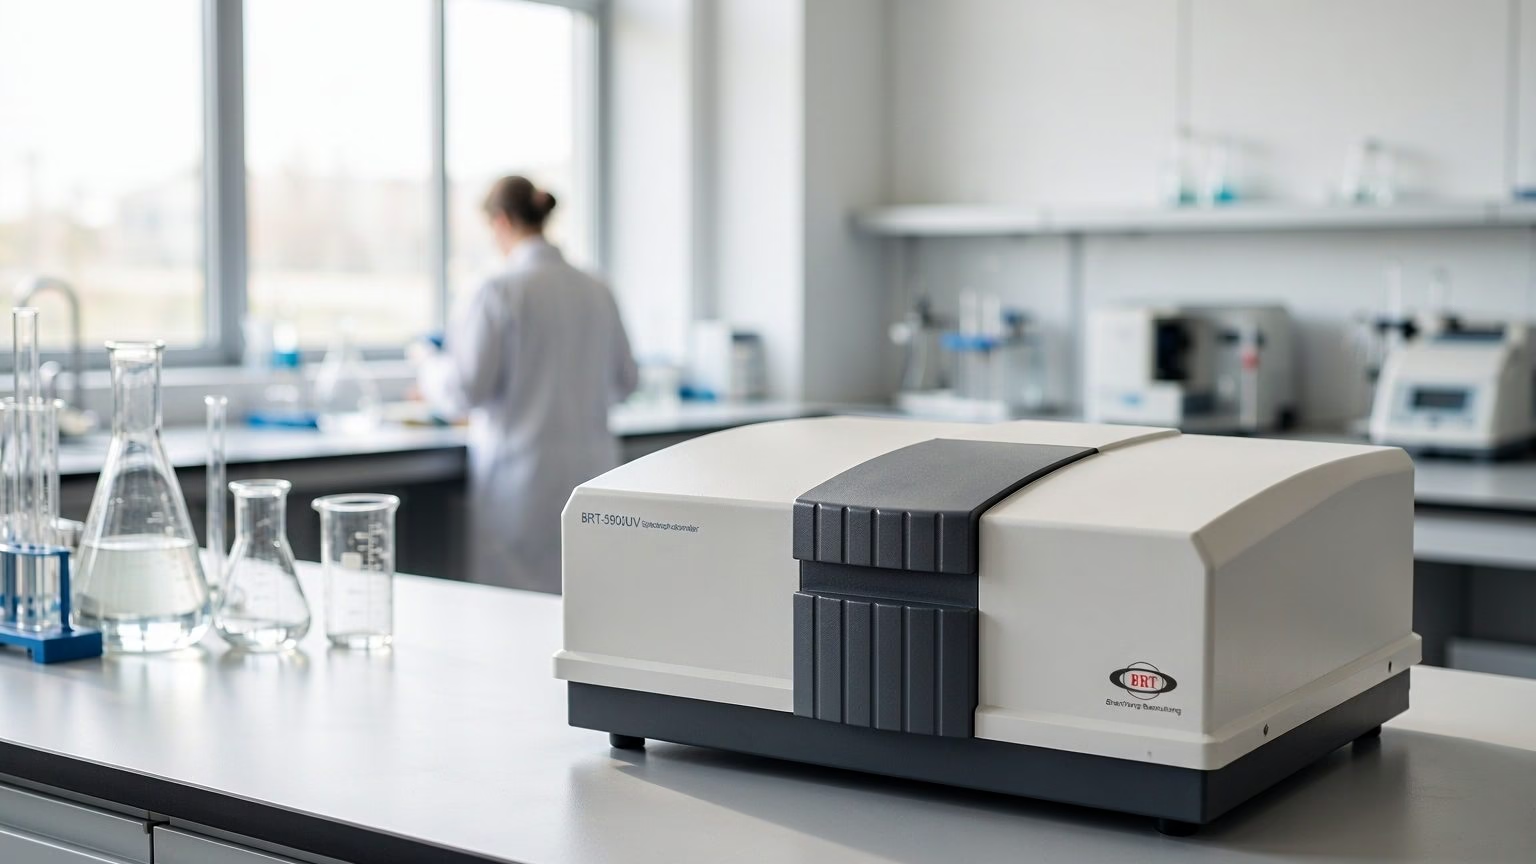
UV-Vis spectroscopy in pharmaceutical testing is a narrower tool than it was in the 1990s, and that is why it is worth being precise about where it belongs. A modern pharmaceutical laboratory has HPLC, LC-MS and often spectroscopy in the same room, so the interesting question is not whether UV-Vis is used but where it is still the right tool.
The four routine applications
Assay by direct absorbance works where the product has one active ingredient, a clean ultraviolet chromophore and no excipient that absorbs at the analytical wavelength. It is fast, needs no separation and consumes little solvent.
Dissolution is the strongest remaining territory. A dissolution bath runs six or eight vessels for hours, and a UV flow cell reads each vessel in sequence without anyone drawing a sample. Replacing that with HPLC means a sampler, a column and a much longer turnaround.
Content uniformity needs a measurement per unit, and the volumes are small. A UV reading in a 1 cm cell is often sufficient where the acceptance criteria are wide.
Identity and limit tests use the shape of the spectrum rather than a single point — a maximum at a stated wavelength, or an absorbance ratio between two maxima, is a cheap identity check that pairs well with a chromatographic assay.
Where HPLC displaced it
UV-Vis loses when the sample is a mixture. If a degradation product absorbs near the analyte, direct absorbance cannot separate the two contributions, and no amount of instrument quality fixes that. It also loses where the concentration is too low for a 1 cm path and too dirty for a long one.
The practical rule in method development is that UV-Vis is the default only when selectivity has been demonstrated, not assumed. A method that reports “assay by UV” without a selectivity study is the single most common weakness in a Q2(R2) submission.
UV-Vis Spectroscopy in Pharmaceutical Testing: The Measurement Chain
Before any application number means anything, four things have to be true. Each of them is a verification step with its own reference material, and each is where a laboratory gets caught.
Wavelength accuracy and the bandwidth trap
Wavelength accuracy is verified against a reference material with known maxima. The NIST standard reference material for this purpose, SRM 2034, is a holmium oxide solution in dilute perchloric acid supplied in a sealed 10 mm cell, certified across 14 bands from 240 nm to 650 nm with an expanded uncertainty of about ±0.05 nm 3.
The detail that separates a careful laboratory from a careless one is that the certified peak positions depend on spectral bandwidth. SRM 2034 is certified at six bandwidths between 0.1 nm and 3 nm, and one band shifts by close to a nanometre across that range. A laboratory that compares its measured maximum against a certificate value taken at a different slit width will find an error that does not exist, and may then adjust a perfectly good instrument.
Photometric accuracy and stray light
The full verification procedure, including stray light limits and acceptance criteria, is set out in our guide to UV-Vis wavelength accuracy and stray light verification.
Photometric accuracy is checked with reference solutions or neutral density filters of known absorbance. Stray light is checked at the short-wavelength end, where the lamp output is low and any leakage through the monochromator dominates the reading.
Stray light matters in pharmaceutical work because it compresses the absorbance scale exactly where concentrated samples sit. A method that reads at 2 AU on an instrument with poor stray light is reading an absorbance that is lower than the true value, and the assay result follows it down.
Cells, solvent and the blank
A 1 cm quartz cell is the default. Matched pairs are checked against each other, and the pairing record belongs with the method. Mismatched cells produce a constant offset that looks like a small bias in every result.
The blank is not a formality. It establishes the zero, it captures the solvent’s own absorbance, and in dissolution work it captures the absorbance of the dissolution medium at the analytical wavelength — which is not always negligible.
UV-Vis Spectroscopy in Pharmaceutical Testing: The Four Applications
| Application | What is measured | Critical requirement | Typical failure |
|---|---|---|---|
| Assay | Absorbance of a diluted sample against a standard | Demonstrated selectivity at the chosen wavelength | A degradation product absorbing nearby |
| Dissolution | Absorbance of medium drawn from each vessel over time | Flow cell path length and baseline stability | Medium absorbance or air bubbles in the cell |
| Content uniformity | Absorbance per dosage unit | Consistent dilution and cell handling | Unit-to-unit variation swamped by preparation error |
| Identity / limit | Spectrum shape, maxima or absorbance ratio | Wavelength accuracy at the specified maxima | Slit width different from the validated method |
Assay by absorbance
The calculation is a ratio against a standard of known concentration, so the method is only as good as the standard preparation. Weighing, dilution and the purity of the reference standard set the uncertainty, and the spectrophotometer contributes comparatively little.
This is why assay methods by UV-Vis are usually validated for linearity, accuracy and precision across a narrow range — typically 80 % to 120 % of the nominal concentration — rather than a wide one.
Dissolution
Dissolution is the application where UV-Vis earns its place, and also where the instrument is most exposed to method problems. A flow cell with a long path increases sensitivity but also increases the chance of trapping an air bubble; a short path is more robust but may not reach the required absorbance.
Baseline stability over a multi-hour run is the practical limit. A single-beam instrument drifting over six hours will produce a profile that looks like a real release curve. This is one of the few applications where a double-beam configuration, or a well-controlled single-beam with frequent blanking, is worth the cost.
Content uniformity
Uniformity of dosage units is a per-unit measurement, so preparation dominates. The instrument’s contribution is mostly about reading speed and about not needing a large volume. Small-volume cells and short path lengths are common, and both increase the sensitivity to cell placement.
Identity and limit tests
An identity test by UV-Vis compares the position of maxima or the ratio of two absorbances against a specification. It is cheap and fast, and it is entirely dependent on wavelength accuracy — which is why the verification interval for a laboratory running identity tests should be set by that method, not by a generic schedule.
Validation Under ICH Q2(R2) and Q14
The validation framework has been revised, and the revision changed the shape of the argument rather than the list of tests.
What the Q2(R2) revision changed
Q2(R2) sets out a general framework for analytical procedure validation and is read alongside Q14, which covers analytical procedure development [1] 2. Together they move the emphasis from a one-off validation exercise towards a lifecycle: a defined analytical target profile, a development stage that justifies the method, and a validation stage that demonstrates it meets the target.
For a UV-Vis method the practical consequence is that the validation report should be able to explain why the wavelength, the concentration range and the sample preparation were chosen, not only that the method passed. A method transferred from an old dossier with no development rationale is now harder to defend.
The validation tests and how they look for UV-Vis
| Validation test | How it is demonstrated for a UV-Vis method |
|---|---|
| Specificity | Spectra of placebo, stressed sample and analyte compared at the analytical wavelength |
| Linearity and range | Absorbance against concentration across the claimed range, with the regression and residuals reported |
| Accuracy | Recovery against a reference standard at three or more levels |
| Precision | Repeatability of a single preparation and intermediate precision across days or analysts |
| Detection and quantitation limits | Calculated from the calibration or from signal-to-noise where relevant to a limit test |
| Robustness | Deliberate variation of wavelength, slit width, solvent ratio and cell path |
Robustness deserves more attention than it usually gets in UV work. The two variables that most often sit outside the validated space in routine operation are the spectral bandwidth setting and the cell path length, and both change results silently.
Data Integrity and 21 CFR 211
The instrument produces a number; the regulation is about the record that surrounds it.
| Requirement | Where it sits | What it means in practice |
|---|---|---|
| Instrument calibration | 21 CFR 211.160 | Calibration of instruments used in testing is required, with a defined schedule and documented performance |
| Method suitability before use | 21 CFR 211.165 | The accuracy, sensitivity, specificity and reproducibility of test methods must be established |
| Complete laboratory records | 21 CFR 211.194 | Records must include the method, the raw data, the calculations and a statement of results |
| Stability indicating capability | 21 CFR 211.166 | Where a stability programme applies, the method must be shown to detect change |
The recurring finding in inspections is not a wrong result but an incomplete record: a spectrum printed without the instrument parameters, a calculation in a spreadsheet with no audit trail, or a wavelength check recorded as “pass” without the measured values.
Practical measures that close most of the gap are unglamorous. Lock the method parameters in the software so that the bandwidth and the wavelength cannot be changed at the bench. Print or export the parameters with every spectrum. Keep the reference material certificate with the verification record. Record the measured maximum, not the word “pass”.
Instrument Qualification and the Verification Interval
Qualification is usually described as IQ, OQ and PQ, and the distinction matters because they answer different questions.
Installation qualification confirms the instrument is where it should be, with the right software version and the right environment. Operational qualification demonstrates that it meets its specification across the working range — wavelength accuracy, photometric accuracy, stray light, resolution, baseline flatness and noise. Performance qualification shows that it continues to do so in routine use.
The verification interval is a risk decision, and it should be justified rather than inherited. A laboratory running identity tests by wavelength position has a different exposure from one running a limit test at a single fixed wavelength. Documenting the rationale is what turns an interval into a defensible decision.
Common Mistakes
| Mistake | Why it happens | What to do |
|---|---|---|
| Comparing a measured maximum against a certificate taken at another bandwidth | The bandwidth dependence is not widely known | Record the slit width on the verification sheet and use the matching certificate column |
| Using unmatched cells for a precision study | Cells are assumed identical | Check and record the pairing |
| Reading above the linear range of the instrument | A concentrated sample is convenient | Dilute, or use a shorter path |
| Reporting “pass” for a system suitability check | The record is treated as a formality | Record measured values and acceptance limits together |
| Applying a UV method without a selectivity study | The method was inherited | Run placebo and stressed samples before claiming specificity |
| Ignoring dissolution medium absorbance | The medium is assumed clear | Measure the medium blank at the analytical wavelength |
Equipment
A pharmaceutical QC laboratory usually needs more than one configuration: a double-beam instrument for method development and stability work, and a robust single-beam instrument for routine dissolution and uniformity.
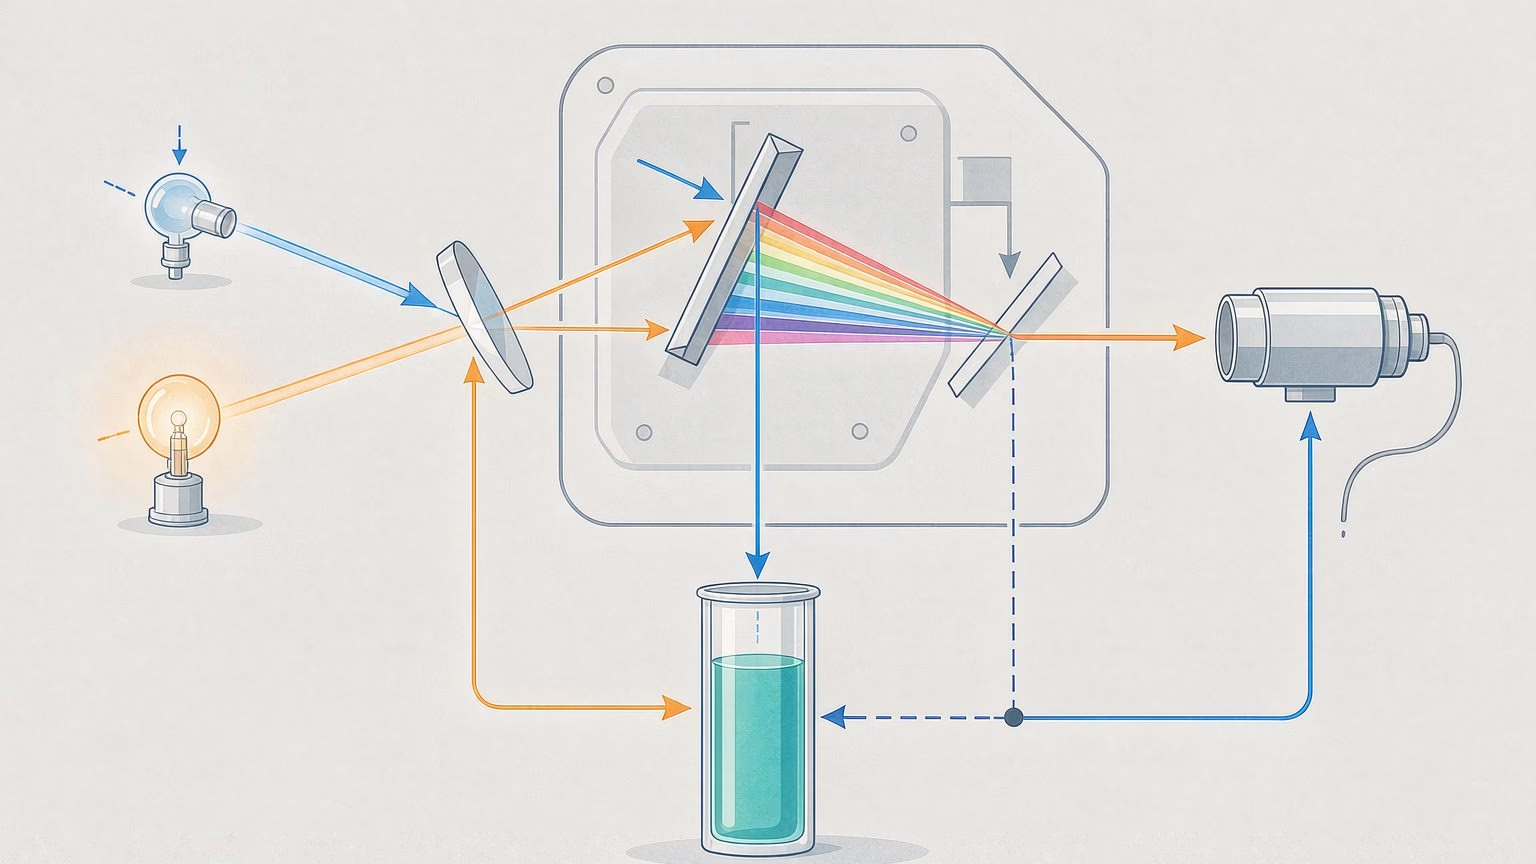
BRT Testing supplies the BRT-1150UV UV Vis spectrophotometer for routine QC, the BRT-6100UV UV Vis spectrophotometer for double-beam work and the BRT-5000UV high precision UV/Vis spectrophotometer where low stray light matters. The UV/Vis spectrophotometer category lists the full range, and our guide to UV-Vis applications in quality control covers the wider QC context.
Frequently Asked Questions
Is UV-Vis still used in pharmaceutical testing?
Yes, and heavily. It remains the default for dissolution profiling, for content uniformity in simple products and for identity tests, because it is fast and cheap per measurement. It has lost ground to HPLC where the sample is a mixture or where a degradation product absorbs near the analyte, so the decision is about selectivity rather than about instrument capability.
How is wavelength accuracy verified in a pharma lab?
Typically against a certified reference material with known maxima, such as NIST SRM 2034, a holmium oxide solution certified from 240 nm to 650 nm with an uncertainty of about ±0.05 nm. The measured maxima are compared with the certificate values at the same spectral bandwidth, because the peak positions depend on slit width.
What does ICH Q2(R2) require for a UV method?
A validation package that demonstrates the method meets a defined analytical target: specificity, linearity and range, accuracy, precision, limits where relevant, and robustness. Read with Q14, the revision also expects the development rationale to be documented, so a method inherited without justification is harder to defend than one with a recorded design.
Can UV-Vis replace HPLC for assay?
Only where selectivity has been demonstrated. If the formulation has one active with a clean chromophore and no excipient or degradant absorbing at the analytical wavelength, a UV assay is defensible and much faster. If anything else absorbs nearby, the method cannot separate the contributions and the result carries an unquantified bias.
Why does dissolution testing favour UV-Vis?
Because a flow cell reads each vessel in sequence without an analyst drawing samples, and a bath can run for hours unattended. The trade-off is baseline stability: a drifting single-beam instrument can produce a release profile that looks real. Frequent blanking or a double-beam configuration protects against that.
What records does 21 CFR 211 expect for a UV measurement?
The method, the instrument and its calibration status, the raw data including instrument parameters, the calculations and a statement of results. Practically, that means the spectrum should carry its wavelength and bandwidth settings, and a system suitability check should record measured values against limits rather than the word pass.
How often should a UV-Vis instrument be verified?
There is no universal interval. The defensible approach is to set it from the methods in use: a laboratory running identity tests by peak position has a different exposure from one running a single fixed-wavelength limit test. Document the rationale, run the verification against a certified reference material, and keep the certificate with the record.
Conclusion: A Decision Order
- Decide whether the method needs separation, because UV-Vis spectroscopy in pharmaceutical testing cannot supply it. If a degradant or excipient absorbs nearby, UV-Vis is the wrong tool regardless of instrument quality.
- Fix the analytical wavelength, bandwidth and concentration range, and record why those choices were made.
- Verify wavelength and photometric performance against a certified reference material at the same bandwidth the method uses.
- Validate to Q2(R2) with a documented development rationale, and treat robustness as a real test rather than a formality.
- Make the record complete: parameters with the spectrum, measured values with the limits, and the reference certificate with the verification.
Talk to BRT Testing about a UV Vis spectrophotometer for pharmaceutical QC, or get in touch with the applications you need to cover and the documentation your quality system expects.
About the Author
Written by the BRT Testing application engineering team in Shenyang, China. BRT Testing builds UV-Vis and FTIR spectrophotometers and polymer test equipment for laboratory and industrial users, and supports QC laboratories setting up verification and qualification documentation. Reference documents were checked against the FDA, NIST and eCFR sites on 2 November 2026.
Sources
- U.S. FDA — Q2(R2) Validation of Analytical Procedures — https://www.fda.gov/regulatory-information/search-fda-guidance-documents/q2r2-validation-analytical-procedures
- U.S. FDA — Q14 Analytical Procedure Development — https://www.fda.gov/regulatory-information/search-fda-guidance-documents/q14-analytical-procedure-development
- NIST — Certificate of Analysis, SRM 2034 Holmium Oxide Solution Wavelength Standard — https://tsapps.nist.gov/srmext/certificates/2034.pdf
- eCFR — 21 CFR 211.160, General requirements (laboratory controls) — https://www.ecfr.gov/current/title-21/chapter-I/subchapter-C/part-211/subpart-D/section-211.160
- eCFR — 21 CFR 211.165, Testing and release for distribution — https://www.ecfr.gov/current/title-21/chapter-I/subchapter-C/part-211/subpart-D/section-211.165
- eCFR — 21 CFR 211.194, Laboratory records — https://www.ecfr.gov/current/title-21/chapter-I/subchapter-C/part-211/subpart-D/section-211.194
- eCFR — 21 CFR 211.166, Stability testing — https://www.ecfr.gov/current/title-21/chapter-I/subchapter-C/part-211/subpart-D/section-211.166
- U.S. FDA — Dissolution Methods Database — https://www.fda.gov/drugs/drug-approvals-and-databases/dissolution-methods-database