- What an FTIR Spectrometer Actually Measures
- The Eight Core Uses of an FTIR Spectrometer
- 1. Confirming Polymer Identity and Grade
- 2. Screening Incoming Raw Materials
- 3. Finding Contaminants and Explaining Failures
- 4. Checking Additive, Filler and Degradation Content
- 5. Verifying Coatings, Adhesives and Surface Treatments
- 6. Identifying Pharmaceuticals and Excipients
- 7. Environmental and Emissions Monitoring
- 8. Forensic, Heritage and Materials Research
- Matching the Use to the Sampling Mode
- What an FTIR Spectrometer Cannot Tell You
- Transmission or ATR: Which One Fits the Work
- Matching Instrument Specifications to Identification Work
- Common Misuses and How to Avoid Them
- Frequently Asked Questions
- What is an FTIR spectrometer used for in a factory laboratory?
- Can an FTIR spectrometer identify an unknown material on its own?
- What is the difference between FTIR and UV-Vis spectrophotometry?
- Does FTIR need sample preparation?
- How much sample does an FTIR spectrometer need?
- Can FTIR detect flame retardants and other additives?
- Is FTIR suitable for quality control in production?
- Next Steps
An FTIR spectrometer is used to identify what a material is made of, by measuring how it absorbs mid-infrared light. It answers “what is this?” far more often than “how much of this is there?” — a polymer, a contaminant, a coating, an incoming raw material, a fibre, a tablet binder. The instrument records an absorption spectrum across the mid-infrared range, and because every molecular bond absorbs at characteristic wavenumbers, the resulting pattern acts as a chemical fingerprint that can be matched against reference libraries. This article sets out the eight uses that account for most laboratory FTIR work, the sampling mode each one needs, and the questions the technique genuinely cannot answer.
What an FTIR Spectrometer Actually Measures
An FTIR spectrometer does not “see” molecules. It measures the fraction of infrared energy absorbed as the beam passes through a sample, across roughly 4,000 to 400 cm⁻¹, and plots that absorption against wavenumber 3. Bonds that change dipole moment when they stretch or bend — O–H, N–H, C–H, C=O, C–O, C≡N — absorb at wavenumbers fixed by the bond type and its local environment. The Fourier transform is simply the mathematics that converts the raw interferogram into that spectrum quickly and with a good signal-to-noise ratio.
The Functional Group Region and the Fingerprint Region
The mid-infrared spectrum is read in two halves. From 4,000 to about 1,500 cm⁻¹ sit the functional-group bands: a broad O–H stretch near 3,300 cm⁻¹ says “alcohol, phenol or moisture”, a sharp C=O near 1,710 cm⁻¹ says “ester, ketone or acid”. Below 1,500 cm⁻¹ the bands become dense and coupled, and that region is treated as a fingerprint: it is rarely assigned bond by bond, but it is highly specific to the whole molecule. Identification work therefore relies on the full spectrum, not on two or three peaks — which is why library searching, not visual peak-picking, is the standard approach for routine confirmation 2.
Why Sample Preparation Decides Whether You Get a Usable Spectrum
The most common reason a spectrum cannot be interpreted is the sample, not the instrument. A film pressed too thick saturates the strongest bands and flattens the rest; a badly diluted powder scatters light and tilts the baseline; residual solvent adds bands that belong to nothing in the sample. ASTM E1252 sets out the general techniques for obtaining interpretable spectra from solids, liquids and gases precisely because preparation changes the result more than instrument grade does [2]. A practical rule: aim for the strongest band to sit at roughly two-thirds of full scale, and if it does not, change the path length before changing any instrument setting.
The Eight Core Uses of an FTIR Spectrometer
These eight account for the majority of spectra recorded in industrial and contract laboratories. They differ in what is being asked, and therefore in which accessory is fitted.
1. Confirming Polymer Identity and Grade
The largest single use is answering “which polymer is this?” for pellets, mouldings, film, pipe, cable insulation or recycled flake. PE, PP, PS, PET, PVC, polyamide and polycarbonate each give a distinct fingerprint, and the technique separates a copolymer from a blend or flags a swapped grade. In incoming inspection the question is narrow — does this lot match the approved reference? — so a pass/fail comparison is enough. Our polymer identification and QC workflow covers how reference spectra and match thresholds fit together.
2. Screening Incoming Raw Materials
Chemical, pharmaceutical and food manufacturers use FTIR as a fast identity check on drums and bags before release to production. The value is speed and coverage: a spectrum takes a minute or two and catches mislabelled containers, substituted grades and contaminated deliveries that paperwork would have passed. It is an identity test, not a purity test — a match proves the substance claimed, not that it meets specification.
3. Finding Contaminants and Explaining Failures
When a part cracks, a surface will not bond, or a batch discolours, FTIR is often the first analytical step because it can examine a speck, a smear or a fracture surface directly. A speck that proves to be oxidised polymer, a bloom that turns out to be a slipping agent, a failed bond with traces of release agent — these are routine answers. Because the technique localises chemistry, it pairs well with microscopy: find the inclusion visually, identify it spectroscopically.
4. Checking Additive, Filler and Degradation Content
FTIR detects the functional groups that additives carry — ester, amide, siloxane, phosphate, carbonate — so it can confirm that a flame retardant, antioxidant, plasticiser or coupling agent is present and whether it survived processing. It is equally useful in the negative direction: carbonyl bands appearing in a polyolefin after weathering or repeated extrusion are direct evidence of oxidation, which is why FTIR is standard in ageing studies.
5. Verifying Coatings, Adhesives and Surface Treatments
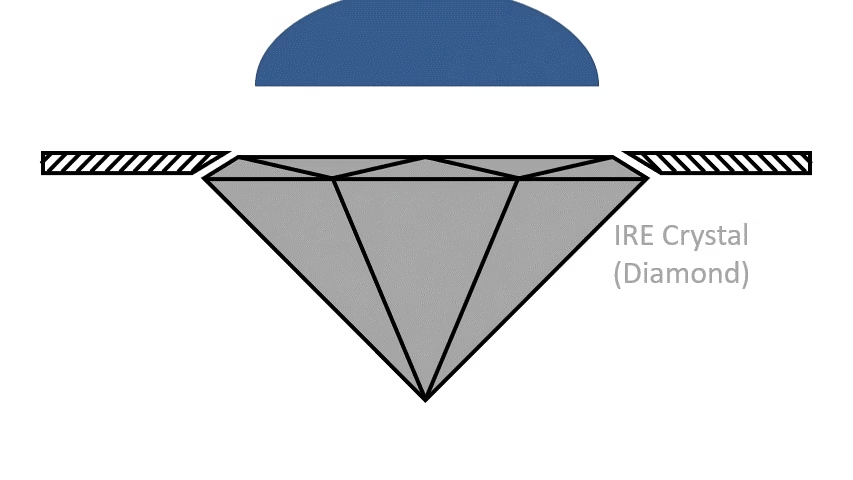
Cure state, cross-link density and surface chemistry are all visible in the infrared. FTIR distinguishes a fully cured epoxy from one that is not, identifies the chemistry of an unknown coating, and confirms that a corona, plasma or primer treatment changed a surface. For thin films, ATR with a diamond or ZnSe crystal is the usual route: it samples the top micrometre without destructive preparation.
6. Identifying Pharmaceuticals and Excipients
Pharmacopoeial identification tests for many raw materials are infrared tests: the sample spectrum is compared with that of a reference substance or reference spectrum. USP <197> and Ph. Eur. 2.2.24 both build identity confirmation on infrared comparison, and ATR has made that practical for hygroscopic or poorly crystalline materials that are awkward to prepare as KBr discs.
7. Environmental and Emissions Monitoring
Gas-phase FTIR measures several species at once in a heated gas cell — CO, CO₂, NO, N₂O, SO₂, HCl, NH₃ and volatile organics — which is why it appears in stationary-source monitoring and workplace air studies. One instrument covers many gases continuously and non-destructively, without wet-chemical consumables. Long-path cells push detection limits down, at the cost of more careful handling of water vapour and temperature.
8. Forensic, Heritage and Materials Research
FTIR identifies fibres, paints, adhesives, tapes, drug residues and polymer traces in forensic casework; ASTM E2224 addresses fibre analysis by infrared spectroscopy specifically 5. In conservation it answers questions that cannot be answered destructively — which varnish, which consolidant, whether a pigment is original — from a few micrograms.
Matching the Use to the Sampling Mode
The accessory, not the spectrometer, decides whether a use is practical. The table below maps the common questions to the sampling approach that normally suits them. If the question is “how much” rather than “what is this”, the instrument you want is probably a UV-Vis spectrophotometer instead.
| Question being asked | Typical sample | Sampling mode that usually fits | Why |
|---|---|---|---|
| Which polymer is this pellet or moulding? | Solid, opaque, uneven | ATR, single or multi-bounce | No preparation, thickness irrelevant, surface is enough |
| Is this incoming liquid the right chemical? | Solvent, oil, resin | ATR or sealed liquid cell | Fast clean-up, reproducible path length with a cell |
| What is this thin coating or surface layer? | Film on substrate | ATR with diamond or ZnSe | Samples the top micrometre without removing the coating |
| What is this speck or inclusion? | Micro-sample | FTIR microscope | Visual targeting then spectrum from the same spot |
| Which gases are in this stream? | Hot gas | Heated long-path gas cell | Multiple species in one measurement, no sampling train |
| Is this powder the correct raw material? | Powder | ATR, or KBr pellet for reference work | ATR for speed, pellet for library-grade comparison |
| Has this material oxidised? | Aged polymer | ATR or transmission film | Carbonyl growth is visible without extraction |
What an FTIR Spectrometer Cannot Tell You
Knowing the boundaries prevents the most expensive misapplication of the technique.
- It is not an elemental method. FTIR shows functional groups, not the periodic table. It will not quantify lead, cadmium or halogen content as elements; XRF or ICP-OES does that.
- It is weak at trace levels. Identification normally needs the component to be a meaningful fraction of the sample. Finding an impurity at parts-per-million in a solid is a chromatography job.
- It struggles with complex mixtures. Five polymers blended together produce five superimposed fingerprints. Separation first, identification second.
- It says nothing about molecular weight or crystallinity. Two polyethylene grades with very different flow behaviour can give near-identical spectra; melt flow index and DSC answer those questions.
- Water and CO₂ interfere. Both absorb strongly, so aqueous samples need ATR and careful subtraction, and hygroscopic optics need dry purge.
- IR-inactive species are invisible. Symmetric diatomic molecules such as N₂ and O₂ have no infrared absorption, which is why gas analysis measures the other species and calculates the rest.
Transmission or ATR: Which One Fits the Work
Both modes produce a mid-infrared spectrum of the same sample, and for identification the library match is usually equivalent. The choice is operational.
When ATR Is the Better Default
ATR wins whenever samples arrive as they are: pellets, mouldings, pastes, liquids, films on a substrate. Because the beam reflects inside a high-refractive-index crystal and only an evanescent wave enters the sample, effective path length is set by the crystal and the wavelength rather than by sample thickness — typically a fraction of a wavelength to a few micrometres. Thickness therefore stops mattering and clean-up is a wipe. The trade-offs are a wavelength-dependent penetration depth, which slightly distorts band ratios against transmission libraries, and crystal materials that differ in hardness and chemical resistance — the subject of our ATR crystal comparison.
When Transmission Still Wins
Transmission remains the reference mode for quantitative work and for matching older libraries, because path length is fixed and defined. It is also better for dilute solutions, gas cells and thin films where you want the whole cross-section rather than the surface. The cost is preparation: KBr pellets must be dry and transparent, mulls must be uniform, and hygroscopic optics need purging. If your lab mostly answers “what is this?”, ATR is the practical default; if it answers “how much?”, transmission with a defined cell usually is.
Matching Instrument Specifications to Identification Work
Most specification sheets are written for a buyer comparing numbers rather than for a user asking what the number changes. For identification work, four specifications matter more than the rest.
| Specification | What it changes in practice | What to look for in an identification lab |
|---|---|---|
| Spectral range | Whether you can see the full mid-infrared fingerprint | Coverage of 4,000–400 cm⁻¹; a cut-off above 500 cm⁻¹ hides low-wavenumber bands |
| Resolution | Whether closely spaced bands separate | 4 cm⁻¹ is the normal working setting; higher resolution helps gases and closely related grades |
| Signal-to-noise ratio | How fast a weak band becomes visible | Enough to reach a clean spectrum in a short scan; ask for the test condition, not just the figure |
| Detector type | Speed and sensitivity for weak signals | DTGS for routine room-temperature work; cooled MCT where speed or weak bands matter |
Two points are usually undersold. Purge or desiccation decides whether a spectrum is stable on a humid day, and library access with match-score reporting decides whether an operator can defend an identification. NIST maintains reference spectral data in the Chemistry WebBook, and certified films such as SRM 1921b are used for wavenumber calibration — the usual demonstration that the axis has not drifted 14. NIST’s programme material covers traceability of spectrophotometric performance 6.
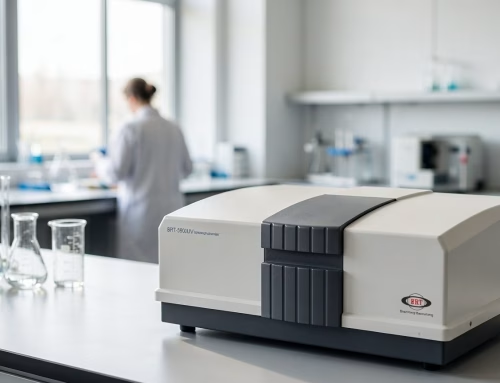
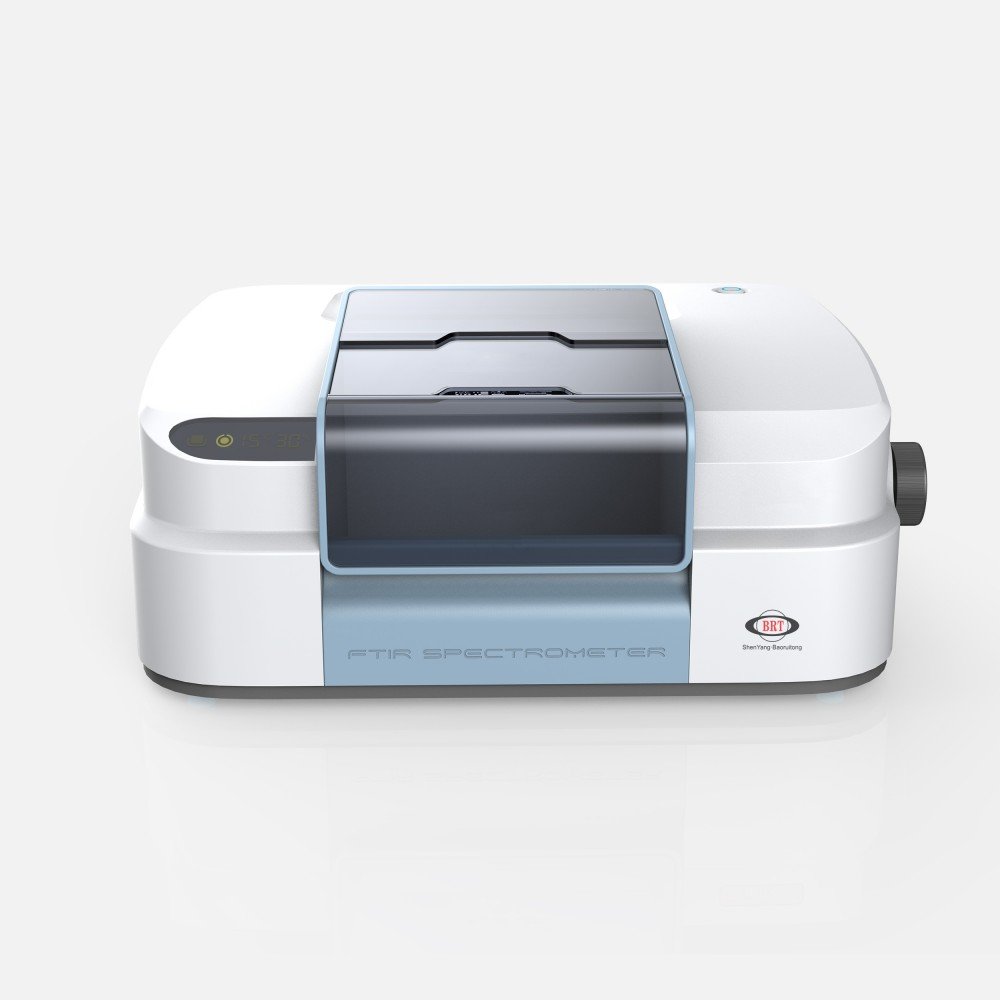
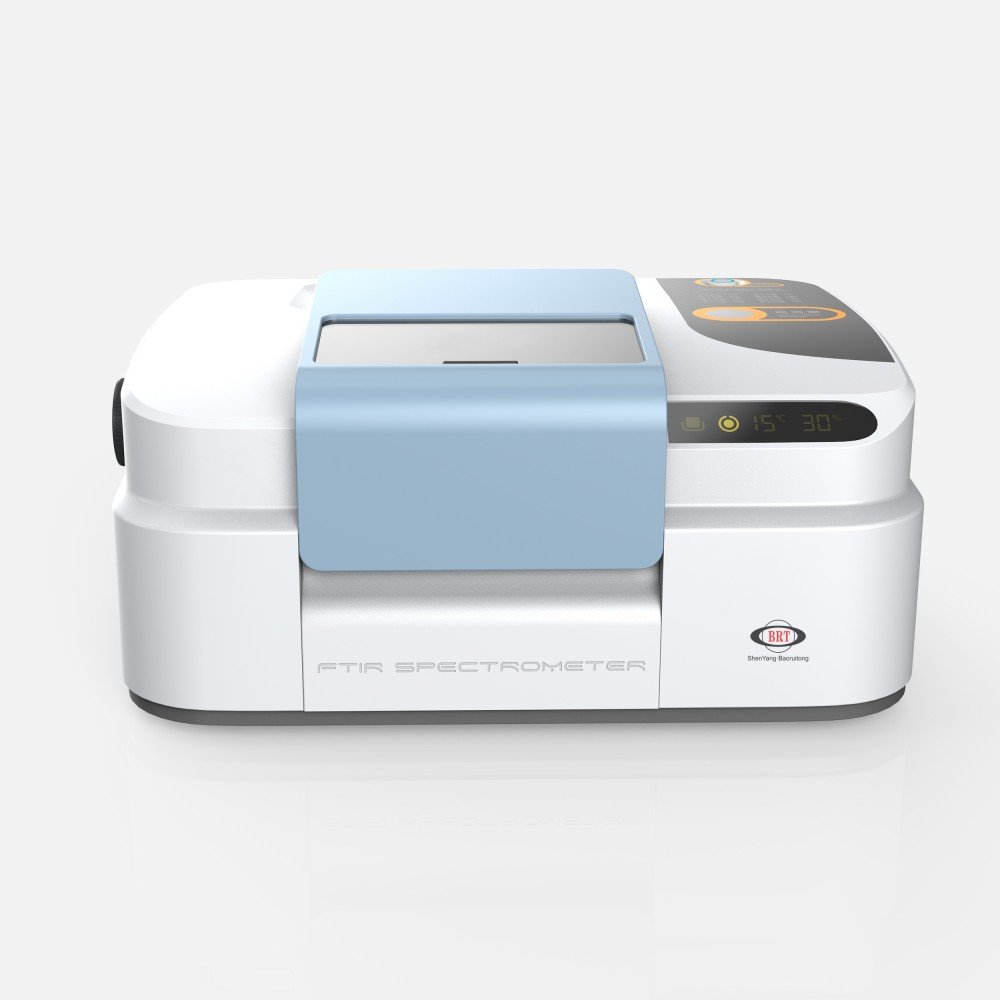
BRT Testing builds bench FTIR instruments aimed at this identification work — the BRT-8 Plus, BRT-850, BRT-860 and BRT-890 differ in optics, detector options and accessory fit; confirm the current specification on each product page. The full range sits under FTIR spectrometers.
Common Misuses and How to Avoid Them
Four habits cause most of the bad spectra in circulation.
Reporting a library hit as an identification. A high match score means the spectrum resembles a library entry, not that the sample is that substance. Confirm with a reference standard run on the same instrument, or a second technique, before a result carries a specification.
Comparing ATR spectra against transmission libraries without saying so. Band ratios shift with penetration depth. Harmless for identification, not harmless when someone reads crystallinity or additive ratio from the numbers.
Ignoring the substrate. A coating measured through a substrate can show substrate bands, and a laminate can show the adhesive instead of the skin.
Treating FTIR as quantitative without a calibration. Beer-Lambert behaviour holds only with controlled path length, stable baseline and a calibration built on the same matrix.
Frequently Asked Questions
What is an FTIR spectrometer used for in a factory laboratory?
It is used mainly to confirm identity: which polymer a part is made from, whether an incoming drum contains the chemical claimed on the label, what a contaminant speck consists of, and whether a coating has cured. Most factory FTIR work is pass or fail comparison against a stored reference spectrum rather than research.
Can an FTIR spectrometer identify an unknown material on its own?
It can narrow the answer quickly, but not close it on its own. The spectrum is searched against reference libraries and the best candidates are reported with match scores, then confirmed against a reference standard or a second technique. Complex mixtures and heavily filled materials often need separation before identification is defensible.
What is the difference between FTIR and UV-Vis spectrophotometry?
They answer different questions with different physics. FTIR probes molecular bonds through infrared absorption and is the better tool for identifying what a substance is. UV-Vis probes electronic transitions and is the better tool for measuring concentration of an absorbing species in solution. Many laboratories keep both instruments side by side.
Does FTIR need sample preparation?
With an ATR accessory, usually not: pellets, mouldings, pastes, liquids and films can be measured as received and the crystal wiped clean afterwards. Transmission work does need preparation, such as a KBr pellet, a mull or a thin film, and gas analysis needs a sealed heated cell. Preparation quality affects the spectrum more than instrument grade does.
How much sample does an FTIR spectrometer need?
ATR needs only contact with the crystal, so a few milligrams or a flat surface is enough. A microscope accessory can work from a speck measured in tens of micrometres. Transmission pellets typically need a milligram or two dispersed in potassium bromide. The practical limit is usually how the sample can be presented, not the mass available.
Can FTIR detect flame retardants and other additives?
It can detect the functional groups those additives carry, which is enough to confirm presence and to track degradation. Brominated and phosphorus-based systems show characteristic bands, and filler types such as carbonate or silicate are recognisable. It does not report elemental concentration, so a compliance claim needs XRF or another elemental method alongside it.
Is FTIR suitable for quality control in production?
Yes, for identity and consistency checks, and it is widely used that way on incoming materials and finished parts. It is less suited to release testing that depends on a numeric value, such as strength or flow rate, because those properties are not directly encoded in the infrared spectrum. Pair FTIR with the physical test that governs the specification.
Next Steps
If you are specifying an FTIR spectrometer, work backwards from the question you need answered rather than from the specification sheet:
- Write down the three questions the instrument must answer in the next year — identity, contaminant, coating, gas.
- Decide the sampling mode for each; if any answer needs a microscope or a gas cell, that accessory drives the configuration.
- Check that the range covers 4,000–400 cm⁻¹ and that 4 cm⁻¹ resolution is available as a working setting.
- Ask how library search, match scoring and reference-standard comparison are handled in the software, and ask to see it done.
- Confirm calibration practice — polystyrene film or another certified reference — and what documentation ships with the instrument.
If you would like the eight uses above mapped onto a specific configuration for your laboratory, send us the sample types and the questions you need answered, and our application team will propose one. Get in touch with your sample list, or browse the FTIR spectrometer range first.
About the author. This article was prepared by the BRT Testing application engineering team at Shenyang Baoruitong Automation Equipment Co., Ltd., which designs and manufactures fire testing, spectrophotometric and plastic pipe testing equipment for laboratories in more than one market. Technical content is reviewed against the published standards cited above; where a model specification is quoted, the product page is the controlling document.