- What a UV-Vis Spectrophotometer Measures
- How a UV-Vis Spectrophotometer Works, Component by Component
- What Each Wavelength Range Can Actually Tell You
- Main Applications of a UV-Vis Spectrophotometer
- UV-Vis Spectrophotometer Specifications That Decide Real Work
- Choosing a UV-Vis Spectrophotometer Configuration
- Accessories, Consumables and Hidden Costs
- Frequently Asked Questions
- What is a UV-Vis spectrophotometer used for?
- What is the working principle of a UV-Vis spectrophotometer?
- What is the Beer-Lambert law?
- What is the difference between a single-beam and a double-beam spectrophotometer?
- Which wavelength range do I need?
- Why does spectral bandwidth matter?
- How often should the instrument be verified?
- Next Steps
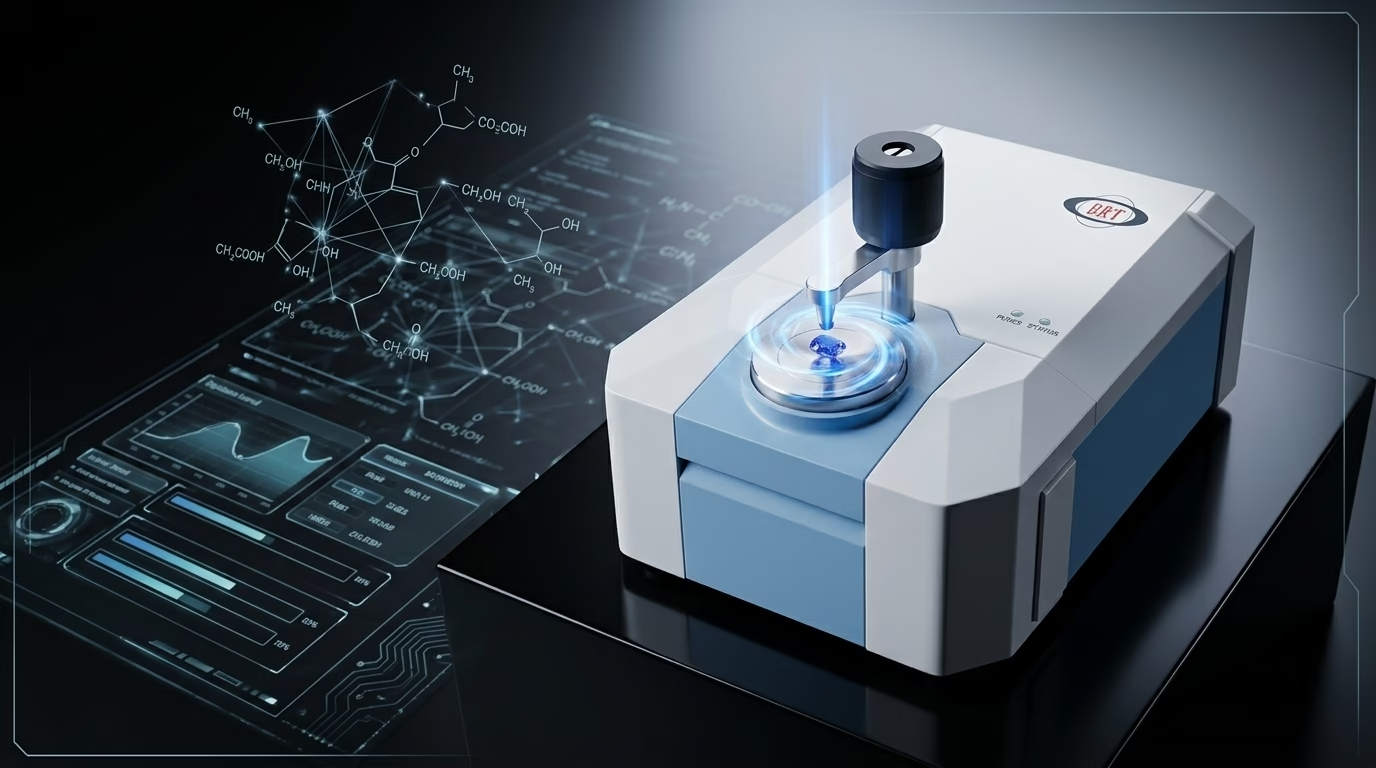
A UV-Vis spectrophotometer measures how much ultraviolet and visible light a sample absorbs, and at which wavelengths. It does this by passing a beam of monochromatic light through the sample and comparing the transmitted intensity with a reference. Because absorbance follows a fixed mathematical relationship with concentration and path length, the instrument converts an optical measurement into a quantitative result: how much of a substance is present. That single capability is why UV-Vis sits in almost every analytical laboratory — pharmaceutical QC, water treatment, food testing, materials research and teaching.
This article walks the optical path from lamp to detector, explains what the two wavelength regions can and cannot tell you, maps the main application areas, and sets out the specifications and configurations that decide whether an instrument will actually hold up in daily work.
What a UV-Vis Spectrophotometer Measures
The instrument measures absorbance (A), defined as the logarithm to base 10 of the reciprocal of transmittance, where transmittance is the ratio of transmitted to incident intensity 1. Absorbance is the working unit because it is linear with concentration, while transmittance is not.
Beer–Lambert in Plain Terms
The relationship is A = εbc, where ε is the molar absorptivity of the analyte at that wavelength, b is the path length through the liquid, and c is concentration [1]. Three practical consequences follow. First, path length is part of the measurement — a 10 mm cuvette and a 50 mm cuvette give different absorbances for the same solution, which is why cuvette path length must be recorded with every result. Second, the relationship holds only for monochromatic light, so spectral bandwidth sets how far from the absorption maximum you can work. Third, linearity breaks down at high absorbance: the European Pharmacopoeia advises that quantitative measurements relying on absorbance values above 2.0 should be avoided [1].
The UV Region and the Visible Region
Coverage is usually quoted as a single range, but the physics differs at each end. The ultraviolet region (roughly 190–400 nm) probes electronic transitions in unsaturated bonds, aromatic rings and conjugated systems, and it is where most pharmaceutical and nucleic-acid work happens. The visible region (roughly 400–780 nm) covers coloured complexes and colorimetric reactions, which is where a large share of environmental and food testing still lives. An instrument that covers 190–1100 nm spans both, plus a useful margin into the near-infrared.
| Spectral region | What absorbs there | Typical use |
|---|---|---|
| 190–250 nm (deep UV) | Strongly absorbing solvents and dissolved gases; simple unsaturated systems | Aromatics, proteins, nucleic acids; demands low stray light |
| 250–320 nm | Aromatic rings, conjugated double bonds | Pharmaceutical assays, DNA and protein quantification |
| 320–400 nm | Extended conjugation, some metal complexes | Dye analysis, UV-absorbing pollutants |
| 400–780 nm (visible) | Coloured complexes and chromophores | Colorimetric water and food methods, reaction monitoring |
| 780–1100 nm | Overtone and combination bands | Extended-range work, instrument verification and NIR-adjacent checks |
How a UV-Vis Spectrophotometer Works, Component by Component
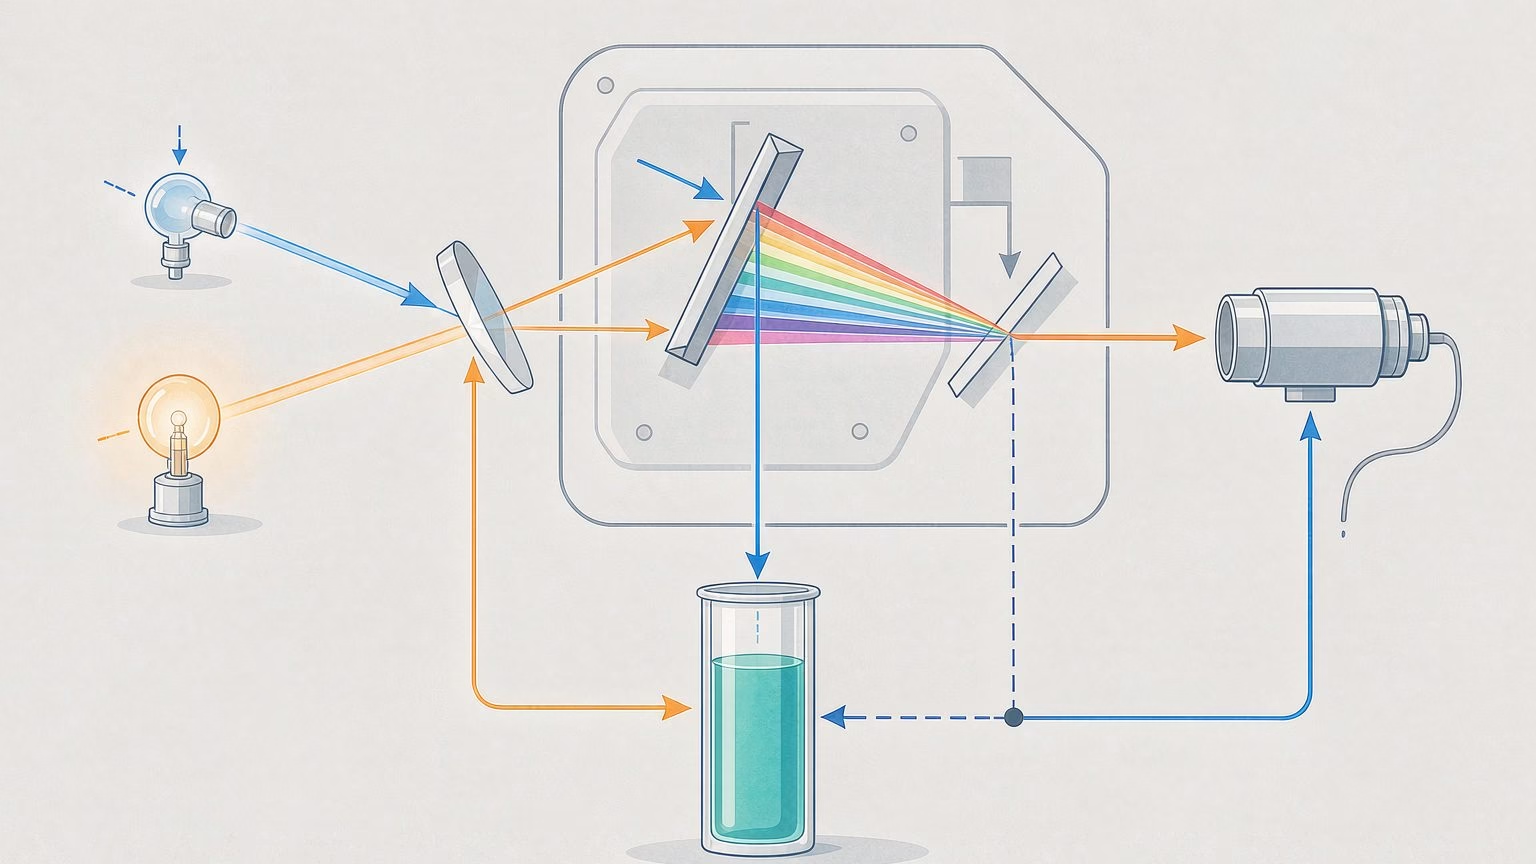
Every UV-Vis spectrophotometer, from a compact bench instrument to a research double-beam system, is the same five-stage chain. Understanding the chain is how you read a specification sheet in the right order.
The Five Stages of the Light Path
- Sources. A deuterium lamp supplies the ultraviolet; a tungsten halogen lamp supplies the visible range. Where they overlap, the instrument switches — and on better instruments the switch point is adjustable, which is what lets you avoid the low-energy seam region 2.
- Monochromator. A diffraction grating together with entrance and exit slits selects a narrow band of wavelengths. Grating density matters: 1200 lines/mm is common, while flagship instruments use 1600 lines/mm for higher resolution.
- Beam handling. The instrument either sends one beam through the sample (single beam) or splits the light between a sample and a reference path (double beam). Beam geometry is the single biggest architectural difference between price tiers.
- Sample compartment. The cuvette or cell sits here. The compartment’s internal width determines which path lengths are practical, from 5 mm micro-cells to 100 mm long-path cells.
- Detector. A silicon photocell covers the common range; a photomultiplier tube is used where very low light levels or very low stray light must be resolved.
Where Single-Beam and Double-Beam Designs Diverge
A single-beam instrument measures the reference and the sample at different times, so any drift in the lamp or detector between the two readings becomes an error in the result. A double-beam instrument measures both nearly simultaneously and ratios them continuously, which cancels source fluctuation and drift — the reason double-beam instruments are preferred for long kinetics runs and for absorbance work at the extremes of the range [2]. For a full breakdown of the trade-offs, including where a single-beam instrument is genuinely the better buy, see our comparison of single-beam versus double-beam spectrophotometers.
What Each Wavelength Range Can Actually Tell You
Two things limit what a UV-Vis measurement can prove. It reports on chromophores — structural features that absorb light — so a molecule with no suitable chromophore is invisible to the technique regardless of concentration. And it measures total absorbance at a wavelength, not identity: two different substances can absorb at the same wavelength.
That is why UV-Vis is used in two distinct modes. In quantitative mode, the wavelength is fixed and the instrument tracks concentration against a calibration curve. In qualitative or verification mode, the spectrum is scanned and the shape, peak positions and peak ratios are compared against a reference. The first mode needs photometric accuracy and linearity; the second needs wavelength accuracy and resolution. An instrument optimised for one is not automatically good at the other, which is why bandwidth and wavelength accuracy appear on every UV-Vis spectrophotometer datasheet and should be read before the price.
Main Applications of a UV-Vis Spectrophotometer
Pharmaceutical and Clinical Analysis
Compendial methods specify UV-Vis determinations for identity, assay and dissolution testing, and they specify the verification materials at the same time. The European Pharmacopoeia requires the wavelength scale to be controlled with holmium perchlorate solution, hydrogen or deuterium discharge lines, or mercury lines, with permitted tolerances of ±1 nm in the ultraviolet and ±3 nm in the visible range, and absorbance to be controlled with potassium dichromate that has been dried to constant mass at 130 °C, with an absorbance tolerance of ±0.01 [1]. Identity work compares absorption maxima and spectral profile against reference standards; assay work uses either a reference solution or a monograph-specific specific absorbance value.
Water and Environmental Testing
Wastewater and drinking-water laboratories rely on UV-Vis for colorimetric determinations — metals, nutrients, phenols and disinfectant residuals — many of which sit inside national approved-method programmes such as the EPA’s Clean Water Act chemical test methods 3. The technique also supports direct UV measurements that need no reagent at all, including UV absorbance at fixed wavelengths as a surrogate for organic load. The practical constraints are cuvette cleanliness, turbidity control and matrix interference, all of which we cover in our guide to UV-Vis spectrophotometry for water quality testing.
Food, Agriculture and Beverage
Colorimetric determination of sugars, proteins, pigments, preservatives and contaminants dominates here, along with enzymatic assays read as absorbance change over time. Sugar and beverage laboratories also use colour indices measured at defined wavelengths. The recurring challenge is sample turbidity and the need for a blank that genuinely matches the sample matrix, because a mismatched blank shifts the whole result.
Industrial Quality Control and Materials
Chemical manufacturing uses a UV-Vis spectrophotometer for raw-material verification, intermediate monitoring and finished-product assay. It also appears in materials work where the measured property is optical rather than chemical — dye concentration in a bath, haze and colour of a polymer film, or the concentration of an additive in solution. Here the method is usually fast, cheap and non-destructive, which is exactly why it survives alongside more powerful techniques.
UV-Vis Spectrophotometer Specifications That Decide Real Work
Five numbers determine whether an instrument can do a specific job. Read them together, because a strong figure in one is meaningless if another fails the method.
| Specification | What it controls | Why it matters in practice |
|---|---|---|
| Spectral bandwidth | Width of the wavelength band reaching the detector | Broad bandwidth flattens sharp peaks and distorts absorbance above ~1.0 A |
| Wavelength accuracy and repeatability | Correctness and reproducibility of the wavelength scale | Peak-position methods and any regulatory identification work depend on it |
| Photometric accuracy | Correctness of the absorbance value | Directly propagates into concentration error |
| Stray light | Unwanted radiation reaching the detector at the wrong wavelength | Sets the upper usable absorbance limit; poor stray light collapses the linear range |
| Baseline flatness and drift | Stability of the baseline over time and wavelength | Decides whether low-absorbance and long kinetic measurements are achievable |
Verifying those numbers is a separate activity from owning the instrument, and it is the one most often skipped. Our article on wavelength accuracy and stray light verification sets out the reference materials and acceptance logic, and the ASTM practice for describing instrument performance gives the test set to work through 4. For quantitative work generally, ASTM E169 covers the general techniques of UV-Visible quantitative analysis, including calibration and the treatment of interfering absorbance 5.
Choosing a UV-Vis Spectrophotometer Configuration
Configuration should follow the method, not the budget. The tiers below run from routine colorimetric benches to research-grade double-beam systems, and every model named is a UV-Vis spectrophotometer unless the row says otherwise.
| Tier | Configuration | Typical method match | BRT models |
|---|---|---|---|
| Entry, routine | Single beam, 4 nm bandwidth, 200–1000 nm | Fixed-wavelength colorimetry, teaching, basic QC | BRT-1100UV, BRT-1200UV |
| Entry, visible only | Single beam, tungsten source only, 325–1050 nm | Colorimetric water and food methods with no UV requirement | BRT-1150V |
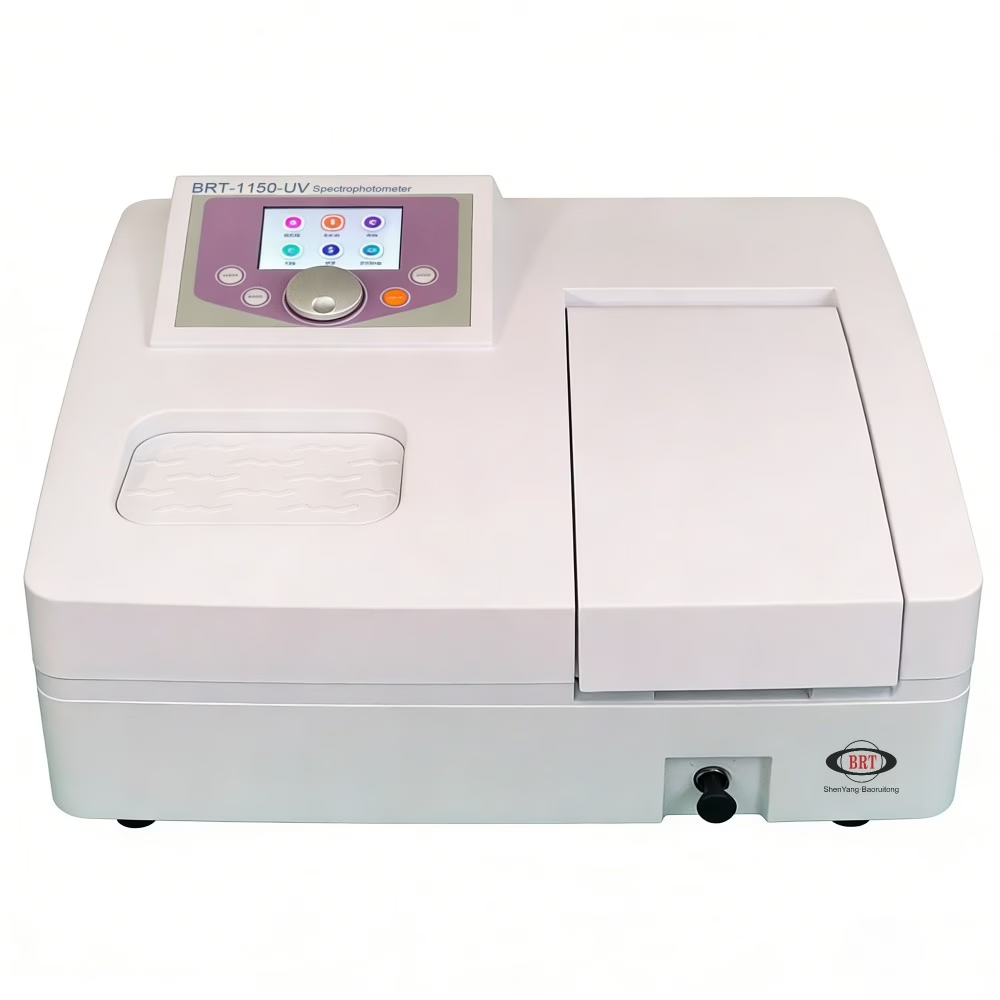
| Compact general | Single beam with C-T monochromator, 2–4 nm bandwidth, 190–1050/1100 nm | Mixed UV and visible routine testing | BRT-1150UV, BRT-1800UV, BRT-5200UV |
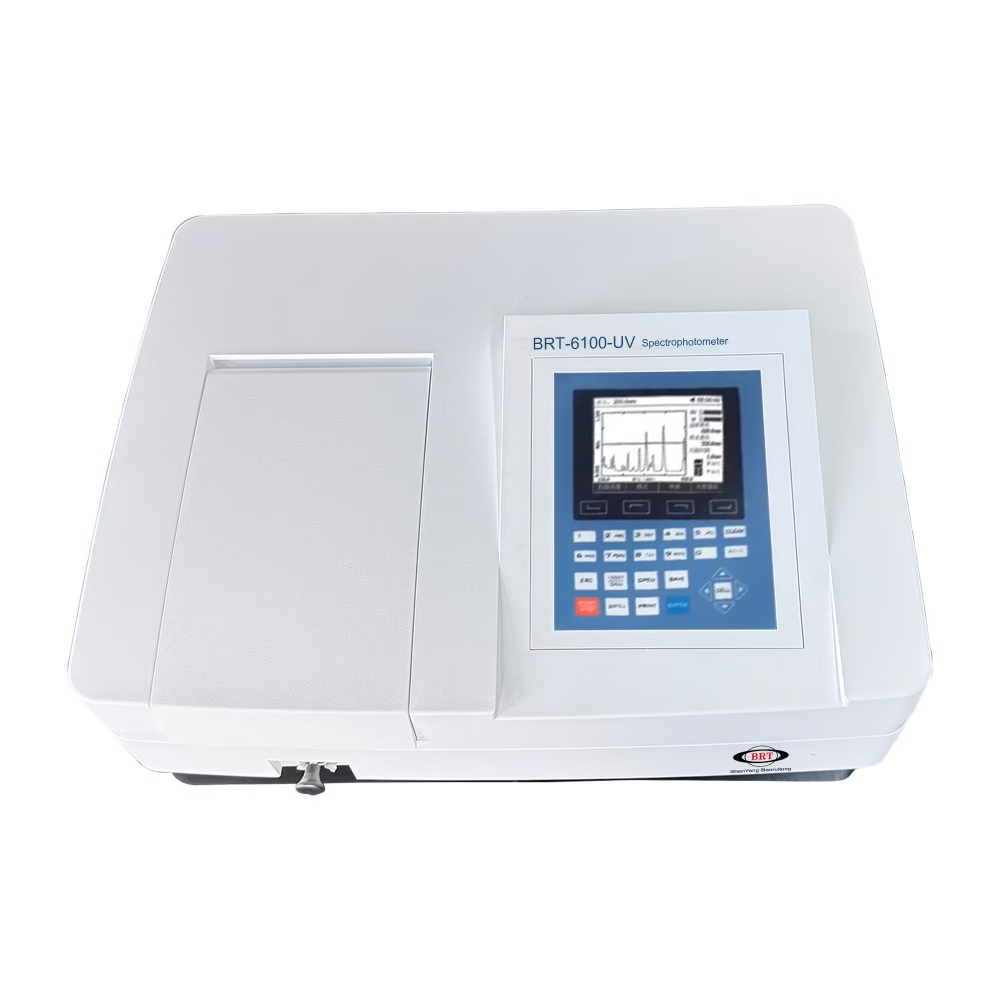
| Precision workhorse | Double beam, 1.8 nm bandwidth, ±0.3 nm accuracy, 190–1100 nm | Pharmaceutical assay, kinetics, spectral scanning, DNA/protein ratios | BRT-3200UV, BRT-5800UV, BRT-6100UV |
| High-throughput | Split double beam with automated 8-cell changer | Batch assays where operator time is the bottleneck | BRT-5400UV, BRT-5600UV |
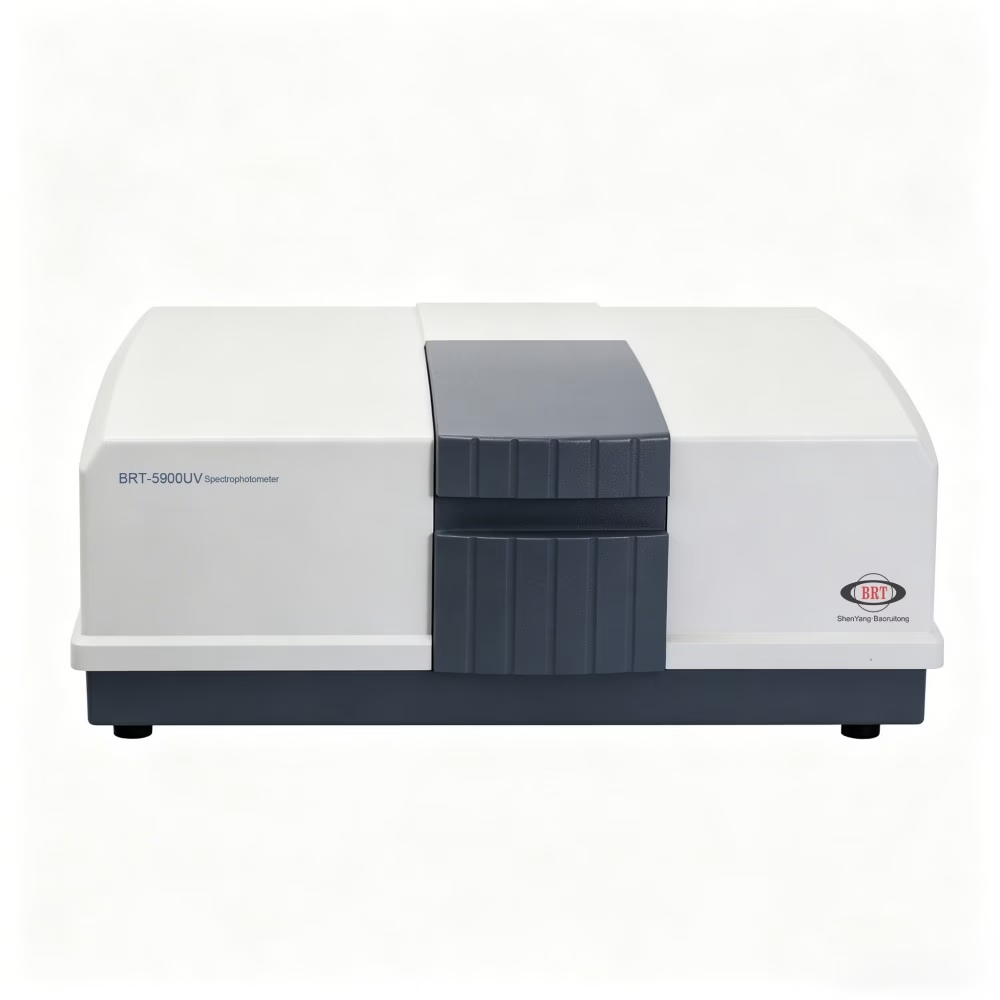
| Research grade | Double beam, 1600 lines/mm grating, PMT detector, 1.0 nm bandwidth, 0.05 nm resolution, ≤0.015 %T stray light | High-density samples and high-purity substances at the extremes of the range | BRT-5900UV |
Selection logic. Start with the wavelength region the method actually needs; a visible-only method never justifies a deuterium lamp. Then fix bandwidth against peak sharpness, and stray light against the highest absorbance the method reaches. Only then decide between single and double beam, and finally consider automation — an 8-cell changer pays for itself on batch assays and is dead weight on single-sample QC. Our broader UV-Vis spectrophotometer buying guide works through the same decision chain from a procurement angle.
Accessories, Consumables and Hidden Costs
A UV-Vis spectrophotometer is rarely the largest lifetime cost over its service life. Four items routinely surprise first-time buyers.
Cuvettes. Quartz is required below roughly 340 nm because ordinary glass absorbs in the UV; visible-only work can use glass or optical plastic. A matched pair costs more than a single cell, and mismatched cells introduce a systematic offset that calibration cannot remove. Reference materials. Wavelength and photometric verification need certified reference materials, and the traceability chain has to be documented. NIST maintains several families: holmium oxide solution certified at 14 bands from 240 nm to 650 nm across six spectral bandwidths, metal-on-fused-silica filters certified at ten wavelengths from 240 nm to 635 nm, and liquid absorbance filters certified at four wavelengths from 302 nm to 678 nm, with the UV-Vis-NIR transmission standard now superseding some older filter sets 67. Lamps. Deuterium lamps have a finite life and their output decays before they fail outright, so replacement intervals should be set from measured energy, not from an assumed calendar. Software and documentation. GLP-compliant software, audit trails and print output have to satisfy the receiving laboratory’s quality system, which is a specification item rather than an optional extra.
Frequently Asked Questions
What is a UV-Vis spectrophotometer used for?
It is used to determine how much of a substance is present in solution, and to confirm identity from an absorption spectrum. Typical work includes pharmaceutical assay and dissolution testing, colorimetric water and wastewater analysis, food and beverage component testing, chemical raw-material verification, and teaching. It is also used to track reaction kinetics, because absorbance can be read continuously as a concentration proxy.
What is the working principle of a UV-Vis spectrophotometer?
Light from a deuterium or tungsten lamp passes through a monochromator that isolates a narrow wavelength band, then through the sample. A detector measures the transmitted intensity, and the instrument compares it with a reference reading to obtain transmittance and then absorbance. Absorbance relates to concentration through the Beer-Lambert law, which is why the reading can be converted into a quantitative result.
What is the Beer-Lambert law?
It states that absorbance equals molar absorptivity multiplied by path length and concentration, written A = εbc. The relationship is linear only under defined conditions, so monochromatic light, matched cuvettes and a matched blank are all required. It also breaks down at high absorbance, which is why many pharmacopoeial methods advise avoiding quantitative measurements that rely on absorbance values above 2.0.
What is the difference between a single-beam and a double-beam spectrophotometer?
A single-beam instrument measures the reference and the sample one after the other, so drift in lamp output or the detector between the two readings becomes an error. A double-beam instrument splits the light and measures sample and reference almost simultaneously, cancelling that drift. Double-beam designs are preferred for long kinetic runs and for measurements near the ends of the usable absorbance range; single-beam designs remain appropriate for fixed-wavelength routine work.
Which wavelength range do I need?
Match the range to the chemistry. If the method is colorimetric and everything absorbs above 400 nm, a visible-only instrument covering roughly 325–1050 nm is sufficient and cheaper to run. If the method involves aromatics, proteins, nucleic acids or any reagent absorbing below 340 nm, you need ultraviolet coverage, which means deuterium illumination and quartz cuvettes. A 190–1100 nm instrument covers both and adds margin.
Why does spectral bandwidth matter?
Bandwidth is the width of the wavelength band that actually reaches the detector. If bandwidth is broad relative to the width of the absorption peak, the instrument averages the peak with its shoulders, which flattens the measured absorbance and reduces apparent sensitivity. The effect grows as absorbance increases, so the same 4 nm instrument that is fine at 0.5 A can be badly wrong at 1.5 A on a sharp peak.
How often should the instrument be verified?
There is no single correct interval, because it depends on the quality system and on how heavily the instrument is used. The defensible approach is risk-based: perform the full wavelength, photometric and stray-light check at installation, after any lamp change or repair, and on a routine schedule, then run a short daily check before reporting data. Record the reference materials used and the acceptance criteria applied, so the verification is auditable.
Next Steps
Work through the decision in this order, and the specification writes itself:
- Fix the wavelength range from the chemistry, not from a brochure.
- Set the highest absorbance the method reaches, then choose bandwidth and stray light to suit it.
- Decide single or double beam based on whether the method runs long or works near the range limits.
- Specify the sample compartment for the cuvette path lengths in use, from 5 mm micro-cells to 100 mm cells.
- Plan the verification materials and schedule before purchase, including the traceability chain.
- Add automation only where it removes a real bottleneck — batch handling, not sample count for its own sake.
If you would like a second opinion on configuration, tell us which methods you run and we will map them to a model and accessory set. You can also browse the full UV-Vis spectrophotometer range to compare tiers side by side.
About the author. This article was prepared by the application engineering team at Shenyang Baoruitong Automation Equipment Co., Ltd. (BRT Testing), which manufactures UV-Vis and visible spectrophotometers, FTIR spectrometers, and fire and materials testing systems for laboratories worldwide. We build the instruments, so we work with the compendial and ASTM requirements directly — but applicability of any method to a specific sample remains the responsibility of the receiving laboratory.
Method requirements and reference-material specifications are revised periodically. Where a standard or pharmacopoeial chapter is cited, confirm the current edition and any local adoption before relying on it in a validated method.