Choose ATR if you identify solids, pastes, films, rubbers or aqueous liquids and want an answer in under two minutes without sample preparation — it is the right default for incoming-goods identification and routine QC. Choose transmission if you need quantitative results against a Beer–Lambert calibration, spectra that match published or pharmacopoeial reference data without correction, or measurements of gases and low-concentration analytes in a bulk matrix. Most laboratories need both, which is why the decision is really about which mode the instrument you buy must serve first — and about four specifications: spectral range, resolution, signal-to-noise ratio with its test conditions stated, and detector type.
That is the whole decision in five sentences. The rest of this ftir spectrometer selection guide explains the optics behind it, the crystal choices inside an ATR accessory, the specifications that separate a routine instrument from a research-grade one, and how to verify at acceptance that you received what the quotation promised. Treat it as an ftir buying guide rather than a product tour: the criteria come first, and the model table comes after them.
How an FTIR spectrometer works, in one paragraph you can act on
A mid-infrared source (in modern benchtop instruments, an air-cooled ceramic or silicon carbide element) emits broadband infrared radiation. A beamsplitter divides that beam between a fixed mirror and a moving mirror; when the two recombine, the path difference between them modulates every wavelength at a different frequency. The resulting interferogram passes through the sample and lands on a detector — typically a pyroelectric DLaTGS element — and a Fourier transform converts the time-domain interferogram into a spectrum 10. The practical consequence for a buyer: resolution is fixed by mirror travel, while signal-to-noise varies across the spectrum — the opposite of the old dispersive instruments, and the reason pharmacopoeial resolution limits designed for dispersive IR created two decades of confusion when applied to FTIR.
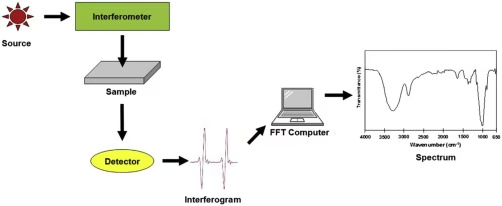
FTIR Fourier transform infrared
The mid-infrared region runs from roughly 4000 to 400 cm⁻¹ in wavenumbers, which is 2.5 to 25 µm in wavelength. Functional-group information lives in the 4000–1500 cm⁻¹ region; the 1500–400 cm⁻¹ fingerprint region is where whole molecules are recognised by pattern rather than by band assignment. The European Pharmacopoeia defines its infrared identification region as 4000–650 cm⁻¹, extendable down to 200 cm⁻¹ in some cases, and it relies on pattern concordance rather than on printed wavenumber tables 9.
| Region | Wavenumber | What it answers | Typical sampling |
|---|---|---|---|
| Near-IR | 12,500–4000 cm⁻¹ | Bulk composition, moisture, protein — overtone bands, weak and overlapping | Transmission, fibre probes |
| Mid-IR, functional group | 4000–1500 cm⁻¹ | Which functional groups are present (O–H, N–H, C=O, C–H) | ATR or transmission |
| Mid-IR, fingerprint | 1500–400 cm⁻¹ | Which molecule this is, by pattern match against a library | ATR or transmission |
| Far-IR | 400–50 cm⁻¹ | Inorganic lattices, metal oxides, polymorphs | Transmission with far-IR optics |
ATR vs Transmission FTIR: the sampling decision that shapes everything else
Transmission
Transmission measures light that has passed through a sample of controlled thickness. The sample sits perpendicular to the beam, and absorbance follows Beer–Lambert directly, which is why transmission is the quantitative reference method. The costs are preparation and thickness control: a 1–2 mg sample ground into 300–400 mg of dried potassium bromide and pressed into a disc at roughly 800 MPa, or a liquid squeezed into a cell of 0.1–0.5 mm path length, or a gas cell about 100 mm long. The European Pharmacopoeia sets a practical quality gate on discs: a disc is rejected if transmittance near 2000 cm⁻¹ falls below 60 % in the absence of a real absorption band, which is a direct symptom of under-grinding or moisture.
ATR (attenuated total reflectance, formally internal reflection spectroscopy)
ATR (attenuated total reflectance, formally internal reflection spectroscopy) never sends light through the sample. The beam travels inside a high-refractive-index crystal and reflects at the crystal–sample interface; a small evanescent field leaks into the sample, and its decay is what produces the spectrum. Because that field decays within a few micrometres, you sample the top few microns, need no thickness control, and get a result from a solid, paste, film or drop of liquid placed on the crystal. ASTM E573 is the governing practice for the technique, covering the theory, the parameters that determine the result, and the interpretation features specific to internal reflection 3.
| ATR | Transmission | |
|---|---|---|
| Sampling depth | Top ~0.5–2 µm (wavelength-dependent) | Full sample thickness (typically 10 µm–1 mm) |
| Sample preparation | None for most solids, pastes, liquids | Grinding + pressing (KBr disc), mulling, or a cell |
| Typical time to spectrum | Seconds to ~1 minute | 5–15 minutes including prep |
| Sample recovery | Recoverable, non-destructive | Pellet is consumed; mull contaminates |
| Quantitative use | Possible, but needs a calibration and constant contact | Direct Beer–Lambert relationship; reference method |
| Match to published libraries | Needs ATR-specific libraries or correction | Matches transmission reference data directly |
| Best sample types | Solids, polymers, rubbers, films, pastes, aqueous liquids, opaque materials | Clear liquids, gases, soluble solids, low-concentration analytes |
| Classic weak point | Optical contact — a poor clamp gives a weak, plausible-looking wrong spectrum | Saturated bands, moisture in the disc, interference fringes |
Choose ATR when the sample is an intact solid you want back, when it is opaque, strongly absorbing, aqueous, a paste or a film, when the question concerns a surface or a coating, or when throughput matters more than matching a legacy library.
Choose transmission when the answer must be quantitative, when band positions and relative intensities must match published transmission reference data without post-processing, when the analyte is dilute in a bulk matrix, or when the sample physically cannot make intimate optical contact with a crystal. For quantitative work the transmission route is the one with an established practice of its own — ASTM E168 covers the general techniques of infrared quantitative analysis 5. The failure modes are asymmetric and worth stating plainly: a bad transmission spectrum usually looks obviously bad and gets rerun, while a bad ATR spectrum often looks plausible — weak because contact was poor, sloped because sampling depth changes with wavelength, or shifted near strong bands — and gets reported.
That wavelength dependence is the detail most buying guides omit. Penetration depth in ATR is a function of wavelength, crystal refractive index, sample refractive index and incidence angle, so an ATR spectrum is not a scaled copy of a transmission spectrum. ASTM E1252 makes the operational rule explicit: spectra that are to be compared must be obtained by the same technique under the same conditions, which is why a laboratory switching between ATR and transmission should maintain separate libraries 4.
High-wavenumber bands are sampled in a thinner layer and appear relatively weaker, and near a strong absorption band the sample’s refractive index changes sharply, producing band shifts and distorted band shapes — a phenomenon called anomalous dispersion. The practical consequences are two: search an ATR spectrum against a transmission library and you can get the wrong answer, and samples with a very high refractive index, such as carbon-black-filled rubber, can distort severely on a diamond crystal until a germanium crystal reduces the penetration depth and restores an interpretable spectrum 7.
Choosing the ATR crystal: the second decision
The crystal is not an accessory detail; it defines which samples your laboratory can measure at all.
| Crystal | Spectral range | Refractive index | Penetration depth at 1000 cm⁻¹ | Hardness (Knoop) | Watch out for |
|---|---|---|---|---|---|
| Diamond | 45,000–10 cm⁻¹ (Bruker) / 7800–400 cm⁻¹ (standard puck) | 2.40 | 1.66–2.0 µm | ~9,000 | Cost; intrinsic absorption bands around 2300–1800 cm⁻¹ in some configurations |
| ZnSe | 20,000–500 cm⁻¹ | 2.41–2.43 | ~2.0 µm | ~130 | Soft and chemically limited: usable pH range roughly 5–9; acidic samples can liberate toxic SeH₂ |
| Germanium | 5,000–600 cm⁻¹ (Specac: 5500–480) | 4.00–4.01 | ~0.65–0.7 µm | ~550 | Narrow range, brittle, optically opaque when heated; ideal for high-refractive-index samples |
| Silicon | 8000–1350 and 500–33 cm⁻¹ | 3.41 | ~0.9 µm | hard | Strong phonon bands between 1350 and 500 cm⁻¹ obscure the fingerprint region |
Sources: Bruker’s published crystal comparison 6 and Specac’s crystal-selection guide with its own depth-of-penetration table calculated at 1000 cm⁻¹, 45° incidence and sample refractive index 1.5 7. Note that the two vendors tabulate slightly different ranges for the same material — always confirm against your instrument vendor’s accessory documentation before specifying.
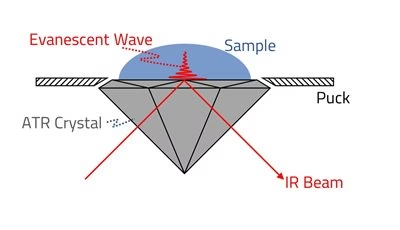
ATR spectroscopy working principle
Three rules cover most laboratories. First, diamond is the default for a mixed sample load: it is the only crystal that survives high-pressure clamping and it tolerates pH 1–14, so it removes the daily question of whether a sample is safe. Second, specify Ge or Si when the sample has a high refractive index or when you want surface-only information, accepting the narrower range and higher fragility. Third, never choose ZnSe for a general-purpose lab with alkaline or acidic samples — pH 5–9 is a genuine operating limit, not a conservative label. If your volume is high and crystals keep getting scratched, a multibounce ATR accessory increases interaction with weakly absorbing samples and low-concentration liquids, at the cost of a longer crystal to clean and protect 6.
The FTIR Buying Guide: the specifications that actually decide performance
The atr vs transmission ftir decision settles your sample preparation and your library; the specification list settles whether the instrument can carry the method you intend. Datasheets are written to be compared favourably, not to be compared with each other, so these are the fields to read in order.
1. Spectral range.
Your range must reach both the functional-group region and enough of the fingerprint region to identify your materials. A range of 7800–350 cm⁻¹ covers the conventional mid-IR need; 7800–375 cm⁻¹ costs you the bottom 25 cm⁻¹, which matters if you work with inorganics or metal oxides whose lattice bands sit low. Ask for the range at the stated resolution — some vendors quote a theoretical range and a working range that differ.
2. Resolution.
Resolution is the smallest wavenumber separation the interferometer can distinguish, set by mirror travel. For polymer and raw-material identification by library search, 4 cm⁻¹ is the working standard and finer resolution buys nothing except noise. Resolution earns its cost in three situations: gas-phase analysis with sharp rotational fine structure, distinguishing close-lying bands in crystalline polymorphs, and separating overlapping bands in mixtures. Note two traps: a resolution figure with no apodisation or phase-correction conditions is not comparable between suppliers, and finer resolution reduces the energy per resolution element, so a “0.85 cm⁻¹” claim is only meaningful alongside a demonstration that the signal-to-noise ratio still holds at that resolution.
3. Wavenumber repeatability and accuracy.
Repeatability is the day-to-day stability of peak position on the same instrument; accuracy is agreement with the true value. Both are verified with polystyrene film — the certified reference is NIST SRM 1921b, a matte polystyrene film about 38 µm thick with 13 certified band positions from 540 to 3125 cm⁻¹, metrologically traceable to SI and valid until 31 December 2026 1. For regulated work, pharmacopoeial wavenumber tolerance is typically of the order of ±1 cm⁻¹; instruments quoted at better than 0.5 cm⁻¹ repeatability leave comfortable margin.
4. Signal-to-noise ratio — with cited test conditions.
This is the most abused number on any FTIR datasheet. SNR depends on resolution, scan time, apodisation, spectral window and whether the value is peak-to-peak or RMS, and the two conventions can differ by several fold. A quotation that says “better than 30,000:1” without “at 4 cm⁻¹, 1 minute, peak-to-peak, 2200–2000 cm⁻¹” is not a specification, it is marketing. Insist on the conditions in writing, and compare only like with like.
5. Photometric (transmission) accuracy.
Expressed as a percentage deviation such as 0.05 %, this characterises how accurately the instrument reproduces transmittance values. It barely matters for qualitative identification and matters a great deal if you intend to build quantitative methods or compare absorbance ratios across instruments.
6. Interferometer and beamsplitter.
A permanently aligned Michelson interferometer removes the need for user alignment and is the practical choice for laboratories without an optical engineer. Sealed and desiccant-protected designs survive humid climates better. The beamsplitter is the most moisture-sensitive component in a mid-IR spectrometer: the standard Ge-on-KBr type is hygroscopic, which is why purge air, desiccant monitoring and a spare beamsplitter budget belong in your planning. Standard optical practice is to confirm resolution and range claims using the reference materials in ASTM E1421, which covers both Level Zero tests (energy spectrum, 100 % line, polystyrene difference spectrum) and Level One quantitative tests 2.
7. Detector.
The pyroelectric DLaTGS detector is the general-purpose choice: room temperature operation, broad mid-IR response, good linearity, no liquid nitrogen. The mercury cadmium telluride (MCT) detector is far more sensitive — a narrow-band MCT can be roughly 50 times more sensitive than DTGS — but it requires cryogenic cooling, has a restricted low-wavenumber cut-off unless you accept lower sensitivity, and its response is non-linear with flux, which can show up as baseline offset 11. At low light levels MCT detectors are around ten times more sensitive than DLaTGS equivalents, while DLaTGS is generally preferred for validation because MCT can saturate and is inherently less linear 10.
Practical rule: specify MCT only if your application genuinely starves the detector — micro-sampling, GC-IR interfaces, fast kinetics, very dark samples — and budget for the coolant or a thermoelectrically cooled alternative.
8. Source, electronics and interface.
An air-cooled ceramic source with a long rated life lowers maintenance frequency; a 24-bit analogue-to-digital converter sampling at high frequency preserves dynamic range. Ask for the source’s rated hours and replacement price, and confirm that the USB interface and software are supported on your operating system for the instrument’s service life.
Matching the instrument to your application
| Application | Sampling mode | Crystal / accessory | Specifications that decide it |
|---|---|---|---|
| Incoming inspection of plastic pellets | ATR | Diamond | 4 cm⁻¹ resolution, ATR library, repeatability |
| Carbon-black-filled rubber | ATR | Germanium | Ge option available; ATR library |
| Coating thickness and surface chemistry | ATR | Ge or Si | Shallow penetration depth |
| Pharmaceutical raw-material identification | Transmission (per monograph) or verified ATR | KBr die set, 10 mm cells, polystyrene CRM | Wavenumber accuracy, resolution, IQ/OQ documentation |
| Additives, plasticisers, dilute analytes | Transmission or multibounce ATR | Liquid cells, multibounce accessory | SNR with stated conditions |
| Aqueous solutions and biological liquids | ATR | ZnSe (pH-limited) or short-path cell | Crystal chemical compatibility |
| Industrial gases | Transmission | ~100 mm gas cell | Purge capability, H₂O/CO₂ compensation |
| Minerals, inorganics, polymorph screening | Transmission (pellet) | KBr or far-IR optics | Low-wavenumber limit (350 vs 400 cm⁻¹) |
| Failure analysis of a single fibre or flake | ATR or micro-ATR | Ge / Si micro-accessory | Beam aperture, detector sensitivity |
The BRT FTIR range: five models, four decisions
The table below maps the models in the BRT Testing spectroscopy range to the specification set above. All five use a Ge-coated KBr beamsplitter and a moisture-resistant high-resolution DLaTGS detector; the differences are in portability, SNR, interferometer architecture and transmission accuracy.
| Model | Type | Range (cm⁻¹) | Resolution | Repeatability | SNR (as published) | ATR | Positioning |
|---|---|---|---|---|---|---|---|
| BRT-800 | Portable, 7 kg | 7800–350 | 0.85 cm⁻¹ | better than 1 cm⁻¹ | better than 30,000:1 | Yes + transmission | Entry portable for field and teaching use |
| BRT-8 Plus | Portable, 7 kg | 7800–350 | 0.85 cm⁻¹ | better than 1 cm⁻¹ | better than 50,000:1 | Diamond/ZnSe ATR + transmission + library search | Portable flagship for receiving-bay identification |
| BRT-850 | Benchtop, 14 kg | 7800–375 | 1 cm⁻¹ | better than 1 cm⁻¹ | >15,000:1 / >30,000:1 | Yes + transmission + QA/QC pass-fail | Routine benchtop QC |
| BRT-860 | Benchtop with humidity alarm, 14 kg | 7800–350 | better than 1 cm⁻¹ | better than 0.5 cm⁻¹ | 30,000:1 at 4 cm⁻¹, 1 min | Yes + transmission + smart library | Humid sites, documented transmission accuracy 0.05 % |
| BRT-890 | High-performance benchtop, 19 kg | 7800–350 | better than 0.85 cm⁻¹ | better than 0.5 cm⁻¹ | 45,000:1 at 4 cm⁻¹, 1 min | Diamond/ZnSe ATR + high-precision transmission + DSP library search | Method development and regulated laboratories |
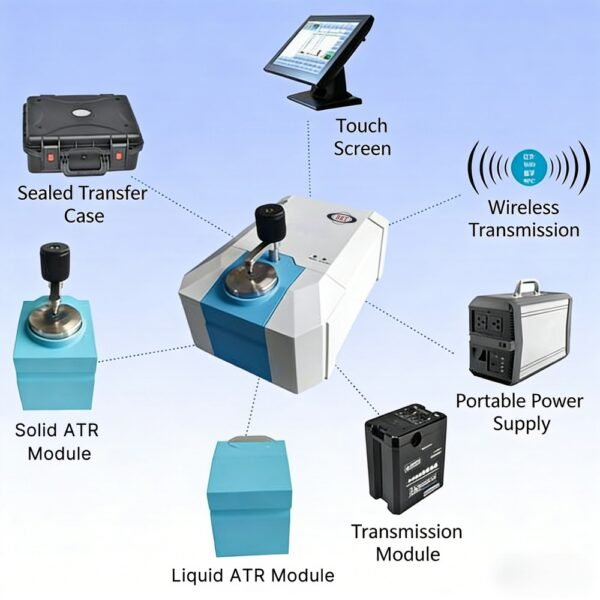
Fourier Transform Infrared FTIR Spectrometer Structure
Selection logic, in the order we would apply it. Start with portability: if identification must happen at the goods-in bay, on a production floor or in a teaching laboratory, the two 7 kg portables decide the conversation, and the only question left is SNR — 30,000:1 versus 50,000:1 — plus whether you want the diamond/ZnSe ATR option. If the laboratory is fixed, go straight to repeatability and transmission accuracy: the BRT-850 covers routine QC with a single-value SNR quotation, while the BRT-860 and BRT-890 declare better than 0.5 cm⁻¹ repeatability and 0.05 % transmission accuracy with the SNR test conditions stated, which is the difference between a pass/fail instrument and one that can carry a validated method.
Between those two, choose the BRT-860 when humidity is a real risk and you value the built-in humidity monitoring with alarm, and the BRT-890 when resolution below 0.85 cm⁻¹, the DSP-driven non-orthogonal interferometer and diamond/ZnSe ATR flexibility justify the larger 520 × 430 × 250 mm footprint.
Browse the full range, including accessories, on the FTIR spectrometer category page.
Accessories, consumables and the real cost of ownership
The instrument is rarely the whole purchase. Six line items decide the true five-year cost.
Crystals and ATR pucks: a diamond accessory can outlast several instruments, while ZnSe pucks are consumables in heavy use — ask for replacement pricing per crystal type.
Sample preparation tooling: a KBr die set, an agate mortar, a desiccator, and a supply of dried KBr or KCl for disc work; potassium chloride rather than KBr is recommended for hydrochloride salts.
Cells: demountable liquid cells with a choice of path lengths, sealed cells for volatile solvents, and a gas cell around 100 mm long with stopcocks if you measure gases 8.
Certified reference materials: polystyrene film to NIST SRM 1921b for wavenumber verification, plus whatever the relevant monograph specifies; treat these as a recurring consumables budget 1.
Moisture control: purge kit, desiccant and — critically — a spare beamsplitter, because the KBr-based beamsplitter is the component humidity destroys first.
Software and documentation: spectral libraries (and specifically an ATR library, not only a transmission library), audit-trail and user-access options if the data feeds a regulated submission, and IQ/OQ documentation if your quality system requires it.
Seven procurement mistakes that surface at acceptance
- Buying on resolution alone. Resolution without SNR at that resolution is half a specification. For polymer identification, 4 cm⁻¹ with a high SNR beats 1 cm⁻¹ with a poor one.
- Comparing SNR values measured under different conditions. Reject any SNR figure that does not state resolution, scan time, apodisation and the spectral window. This single discipline prevents most apples-to-oranges comparisons.
- Assuming ATR and transmission spectra are interchangeable. They are not: sampling depth varies with wavelength and strong bands shift. If your SOPs and libraries are transmission-based, plan the correction or the ATR library.
- Choosing a crystal by price. A cheaper ZnSe puck that fails at pH 9, or a diamond that cannot resolve carbon-black-filled rubber without anomalous dispersion, both cost more than the correct choice.
- Ignoring the beamsplitter’s hygroscopic nature. In a humid or unconditioned laboratory, the beamsplitter, not the source, is the first failure. Budget a spare and a desiccant regime.
- Forgetting that the certificate of analysis is not the specification. Ask what reference materials and conditions the factory used, and request the polystyrene test data for the specific serial number you are buying.
- Buying FTIR to solve a UV/Vis problem, or the reverse. UV/Vis quantifies concentration and electronic transitions in solution; FTIR identifies functional groups and molecular structure. If your question is “how much is dissolved”, start with the UV/Vis spectrophotometer range and the UV/Vis buying guide instead.
Verifying the instrument: an OQ/PQ checklist you can hand to a supplier
Ask the supplier to run these checks on the serial number you will receive, using certified reference materials, and to report the raw data rather than a pass/fail stamp. The framework is ASTM E1421 for FT-MIR performance and ASTM E573 for internal reflection work 23.
| Check | Reference material | What to record | Framework |
|---|---|---|---|
| Wavenumber accuracy | Polystyrene film, NIST SRM 1921b | Measured vs certified band positions, deviation in cm⁻¹ | NIST certificate [1]; ASTM E1421 |
| Resolution | Polystyrene film | Band separation at the specified resolution, with apodisation noted | ASTM E1421 |
| 100 % line (short-term stability) | None — empty beam | RMS noise across 4000–500 cm⁻¹ | ASTM E1421 |
| Energy throughput | None — empty beam | Energy ratio across the spectrum versus baseline | ASTM E1421 |
| Water vapour and CO₂ interference | None | Residual H₂O and CO₂ bands after purge | ASTM E1421 |
| Signal-to-noise ratio | None | Peak-to-peak value at 4 cm⁻¹, 1 min, in a band-free window | Quotation terms |
| ATR equivalence | Polystyrene on the ATR crystal | ATR vs transmission deviation, crystal and clamp pressure recorded | ASTM E573 |
| Repeatability | Polystyrene, 10 consecutive scans | Peak-position standard deviation | Internal SOP |
Six questions to put in writing to every supplier.
- Will you provide IQ/OQ documentation, and against which framework — ASTM E1421, a pharmacopoeial chapter, or an internal protocol?
- What are the exact test conditions behind your published SNR figure?
- Which crystal materials are available for the ATR accessory, and what does each replacement cost?
- Which spectral libraries are included, and are they ATR or transmission libraries?
- What is the rated life and replacement price of the source and the beamsplitter?
- What is your service response time and spare-parts lead time in our region?
Laboratories working under pharmacopoeial identity testing should note one further point: the reference spectra published by the pharmacopoeias are generally measured in transmission with a KBr pellet, and while ATR is widely used in practice for identification, using it in place of a prescribed transmission monograph method without documented equivalence verification is a compliance risk 8. Document the crystal, clamp pressure and equivalence data in your SOP if you make that choice.
Conclusion: the selection order we would follow
Work through these six steps in order; each one narrows the specification set before money is committed.
- Decide the sampling mode that your most frequent sample demands. In any practical atr vs transmission ftir comparison, ATR wins for intact solids, polymers, rubbers, pastes and aqueous liquids; transmission wins for quantitative work, gases and dilute analytes. If both are frequent, buy one instrument with both paths and price the accessories together.
- Fix the spectral range from the sample type, not from the catalogue. 7800–350 cm⁻¹ covers conventional mid-IR identification; check the low-wavenumber limit if inorganics are in scope.
- Set resolution from the method. 4 cm⁻¹ for library identification; finer only for gases, polymorphs or overlapping bands — and only with the SNR at that resolution in writing.
- Convert SNR into a comparable number. Require peak-to-peak, 4 cm⁻¹, one minute, with the spectral window named, from every supplier before you compare.
- Choose the crystal and detector against your real sample list, not against the highest specification available: diamond for a mixed load, Ge or Si for high-refractive-index or surface work, DLaTGS unless your application genuinely starves the detector.
- Agree the verification package before you order. Polystyrene traceable to NIST SRM 1921b, the ASTM E1421 performance set, and IQ/OQ documentation if your quality system needs it.
If you would like this applied to your own sample list, send us the materials you identify most often and the throughput you need, and our application engineers will return a model recommendation with the matching specification set — get in touch with the BRT Testing team.
About the author: this ftir spectrometer selection guide was prepared by the BRT Testing application engineering team at Shenyang Baoruitong Automation Equipment, which manufactures the FTIR and UV/Vis instruments described here. Specifications quoted for the BRT range are taken from our own product documentation dated September 2026; the reference materials cited belong to their issuing organisations. Learn more about BRT Testing.
Frequently Asked Questions
Is ATR or transmission better for FTIR?
Neither is better in general: they answer different questions. Choose ATR for intact solids, polymers, rubbers, pastes, films and aqueous liquids, where no sample preparation and fast throughput matter, and where surface or top-few-micron information is acceptable. Choose transmission when you need quantitative results against a Beer-Lambert calibration, when band positions and intensities must match published transmission reference data, or when you measure gases and dilute analytes in a bulk matrix. Most laboratories need at least one ATR-capable instrument and may keep a transmission path for method compliance.
Can one FTIR spectrometer do both ATR and transmission?
Yes. Every benchtop and portable FTIR in the BRT Testing range supports ATR and transmission, and switching between them is a matter of changing the sampling accessory. ATR models in the range are available with diamond and ZnSe crystals, and transmission work uses KBr discs, demountable liquid cells or a gas cell. Confirm that the ATR crystal you need and the transmission accessories are quoted together, because accessories are frequently priced separately.
What resolution do I actually need in an FTIR spectrometer?
For polymer and raw-material identification by library search, 4 cm-1 is the working standard and finer resolution adds little. Finer resolution – 1 cm-1 or better – earns its cost for gas-phase analysis with sharp rotational structure, for distinguishing close-lying bands between crystalline polymorphs, and for separating overlapping bands in mixtures. Remember that finer resolution lowers the energy per resolution element, so a resolution claim is only meaningful if the instrument also maintains its signal-to-noise ratio at that resolution.
Why are SNR figures not comparable between FTIR suppliers?
Because signal-to-noise ratio depends on measurement conditions. Resolution, scan time, apodisation function, spectral window and whether the value is peak-to-peak or RMS all change the number, and the conventions can differ by several fold. A value quoted as better than 30,000:1 without stating resolution, scan time and window is not a specification. Ask every supplier for peak-to-peak SNR at 4 cm-1 resolution, one minute of scanning, in a band-free window such as 2200-2000 cm-1, and compare only values measured the same way.
Which ATR crystal should I choose for my samples?
Diamond is the general-purpose default: it handles high clamping pressure and roughly pH 1-14, so it works for most solids and liquids. Specify germanium or silicon when the sample has a high refractive index, such as carbon-black-filled rubber, or when you need shallower sampling of a surface layer, accepting the narrower spectral range and greater fragility. Avoid zinc selenide for general lab use unless samples stay within roughly pH 5-9, because acidic samples can damage the crystal and liberate toxic hydrogen selenide gas.
Do I need an MCT detector instead of the standard DLaTGS detector?
Only if your application genuinely starves the detector. DLaTGS is the general-purpose choice: room-temperature operation, broad mid-infrared response, good linearity and no liquid nitrogen, which also makes it preferable for validation work. MCT is substantially more sensitive and is the right answer for micro-sampling, GC-IR interfaces, fast kinetics and very dark samples, but it needs cryogenic or thermoelectric cooling, has a restricted low-wavenumber cut-off, and its non-linear response can offset the baseline.
How do I verify a new FTIR spectrometer at acceptance?
Use polystyrene film traceable to NIST SRM 1921b to check wavenumber accuracy against certified band positions, and run the ASTM E1421 performance set: energy spectrum, 100 percent line stability, and the polystyrene difference spectrum for water vapour and carbon dioxide interference. Record resolution with the apodisation function stated, and ask for signal-to-noise measured at conditions you specified. If the instrument is used in ATR mode, verify equivalence against a transmission measurement on the same polystyrene standard, as described in ASTM E573.
Can ATR be used for pharmacopoeial identification instead of a KBr pellet?
Published pharmacopoeial reference spectra are generally recorded in transmission with a potassium bromide pellet, so a prescribed monograph method remains the reference route. ATR is widely used in practice for identification, but substituting it for a prescribed transmission method without documented equivalence verification is a compliance risk. If you take that route, record the crystal material, incidence angle and clamp pressure, and keep equivalence data against a transmission measurement on the same standard in your SOP.