- What Polymer QC Needs From FTIR Polymer Identification
- How FTIR Polymer Identification Works When the Sample Is a Plastic Part
- The QC Workflow, Step by Step
- Reading a Spectrum in Polymer QC: FTIR Bands That Carry the Decision
- The Misidentifications FTIR Plastic Analysis Actually Produces
- Match Thresholds in FTIR Polymer Identification: Why One Number Cannot Work
- Building an FTIR Library for Polymer QC
- Where FTIR Plastic Analysis Ends and Other Tests Begin
- Choosing an FTIR for Polymer Identification Work
- Verifying an FTIR Before It Enters Routine Polymer QC Work
- Frequently Asked Questions
- What is FTIR polymer identification?
- Can FTIR plastic analysis tell PE from PP?
- Why does my FTIR result not match the supplier’s certificate?
- What hit quality index should a polymer QC laboratory use?
- Is ATR or transmission better for identifying plastics?
- Why does my library search return a natural material as a plastic?
- How many reference spectra does an identification library need?
- Does an FTIR result have to be confirmed by a second technique?
- Conclusion: The Workflow in Six Decisions
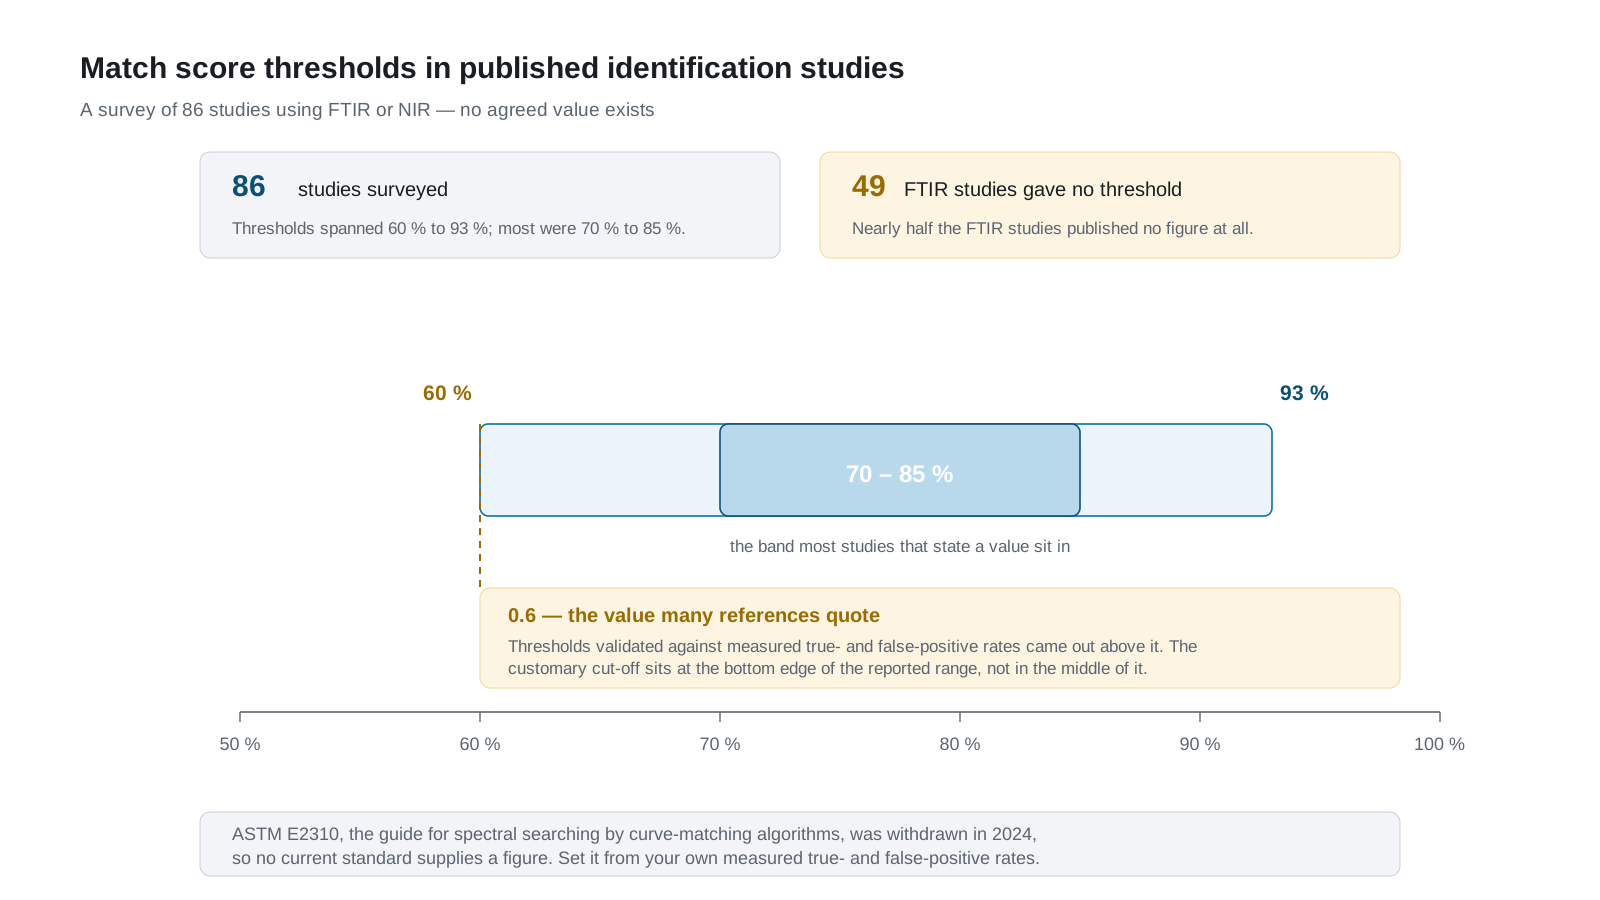
FTIR identifies a polymer in about a minute. What takes a week is agreeing on what counts as an identification. Three things have to be true at once: the spectrum must be acquired on a frozen method so that sampling mode, resolution and preprocessing never vary; the search must run against a library of references acquired the same way; and the match threshold must come from your own measured false-positive rate rather than from habit. Published practice offers little cover — a survey of 86 infrared identification studies found reported match thresholds spanning 60 % to 93 %, with most between 70 % and 85 %, and the ASTM guide that once governed spectral searching was withdrawn in 2024 114. Fix those three decisions and a plastics QC lab gets a result that survives an audit.
What Polymer QC Needs From FTIR Polymer Identification
A polymer control laboratory asks one primary question: is this material the polymer the paperwork says it is? That framing is narrower than the technique’s reputation and far easier to validate. Three sub-questions follow.
The Three Questions an FTIR Polymer Identification Has to Answer
- Is it a single polymer, a blend, or a copolymer? A blend shows the sum of two spectra; a copolymer shows shifted bands and new ones. Peak-picking by eye confuses the two.
- Is the base polymer what it claims to be? This is the incoming-material check, and it carries the commercial consequence.
- Is anything present that should not be? Additives, plasticiser, filler, mold-release residue or a degradation product. FTIR shows them; the workflow decides whether they are a finding or a distraction.
Where FTIR Plastic Analysis Stops Short
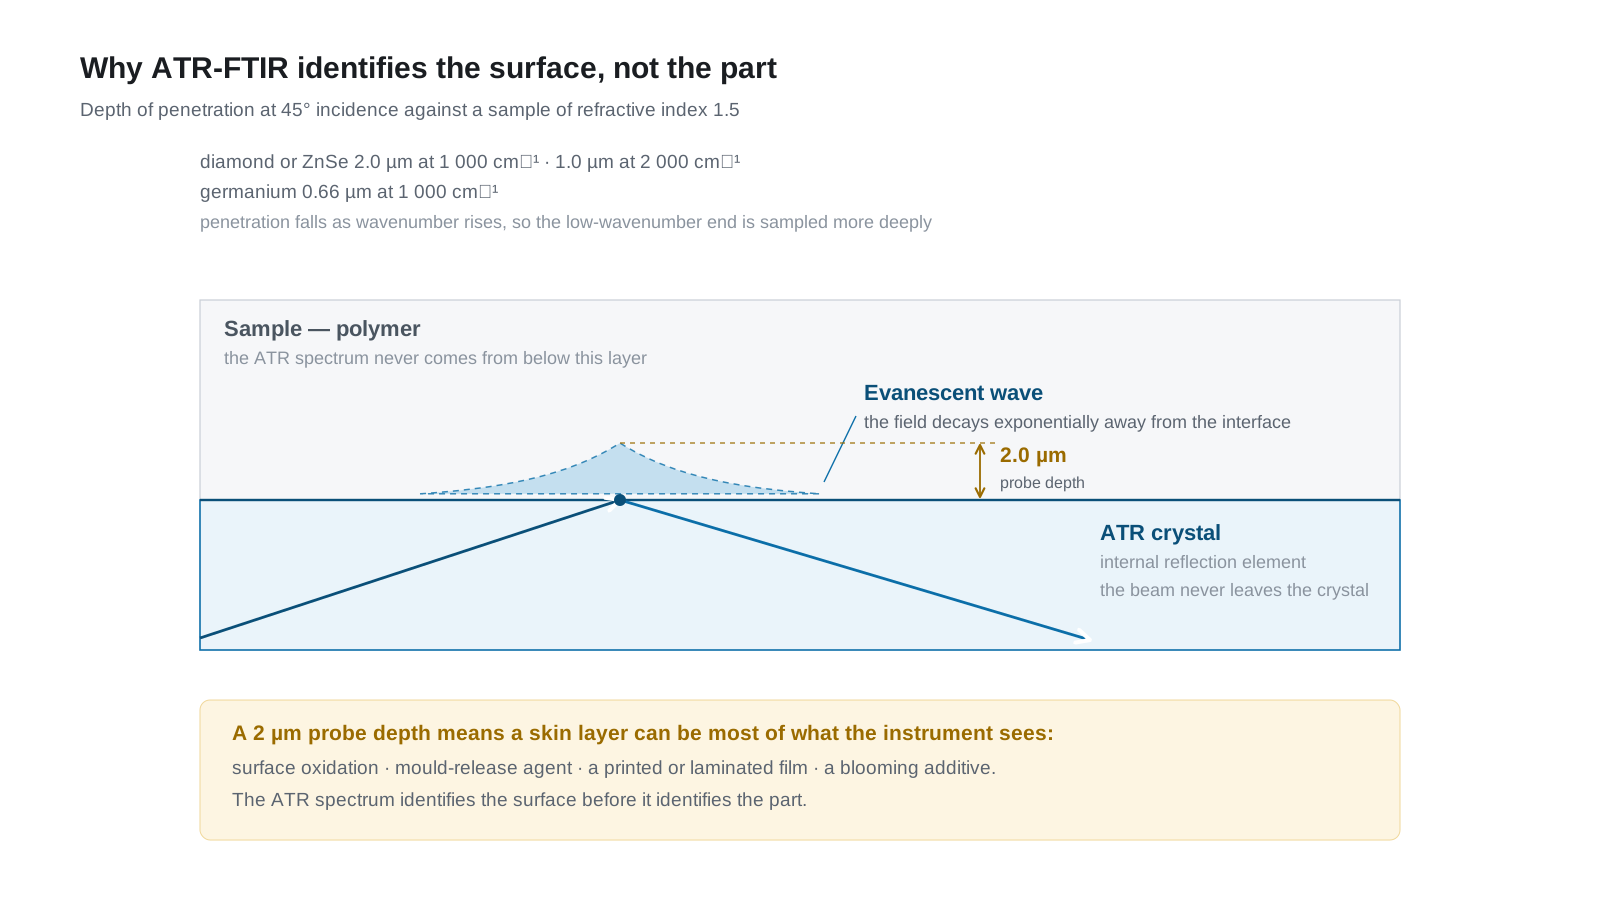
Two limits are structural rather than fixable by better hardware. The first is that FTIR is a surface measurement whenever ATR is used. The evanescent wave decays within a few micrometres: at 45° incidence against an organic sample, the depth of penetration is about 2.0 µm at 1,000 cm⁻¹ for a diamond or ZnSe element and about 0.66 µm for germanium, falling roughly in proportion to wavelength across the scan 78. A skin layer — oxidation, a mold-release agent, a laminated film — can therefore be most of what the instrument sees. The second is that infrared cannot separate polymers whose difference is not a chemical group. Two grades of one polymer differing only in molecular weight give nearly identical spectra, so FTIR confirms identity and says nothing about grade or melt index.
One further constraint is arithmetic: transmission through a diamond or ZnSe element at 45° requires the sample’s refractive index to stay below about 1.70, so heavily filled compounds can fail to give total internal reflection [8].
How FTIR Polymer Identification Works When the Sample Is a Plastic Part
The spectrum records which infrared frequencies the sample’s bonds absorbed. Every band is a vibrational mode, and identification rests on three kinds of evidence: the position of a band, its intensity relative to the rest of the spectrum, and the pattern of bands across a region 910.
Why the Same Polymer Gives Two Different Spectra
Two acquisitions of the same pellet can differ enough to change a library hit, and the causes are all methodological.
- Sampling depth tilts the spectrum. Penetration depth grows toward lower wavenumber, so ATR spectra carry relatively stronger low-wavenumber bands.
- Strong bands shift. Around an intense absorption the sample’s refractive index changes sharply, which red-shifts the band and makes it asymmetric [7].
- Contact pressure changes intensity. Incomplete contact removes signal, not information, and does so unevenly.
- Atmospheric water and carbon dioxide appear as sharp artefacts near 2,350 cm⁻¹ and in the 1,600–1,400 cm⁻¹ region.
The rule that follows: compare ATR spectra with ATR references. A method that searches ATR data against a transmission library measures its own optical mismatch, not the polymer.
The QC Workflow, Step by Step
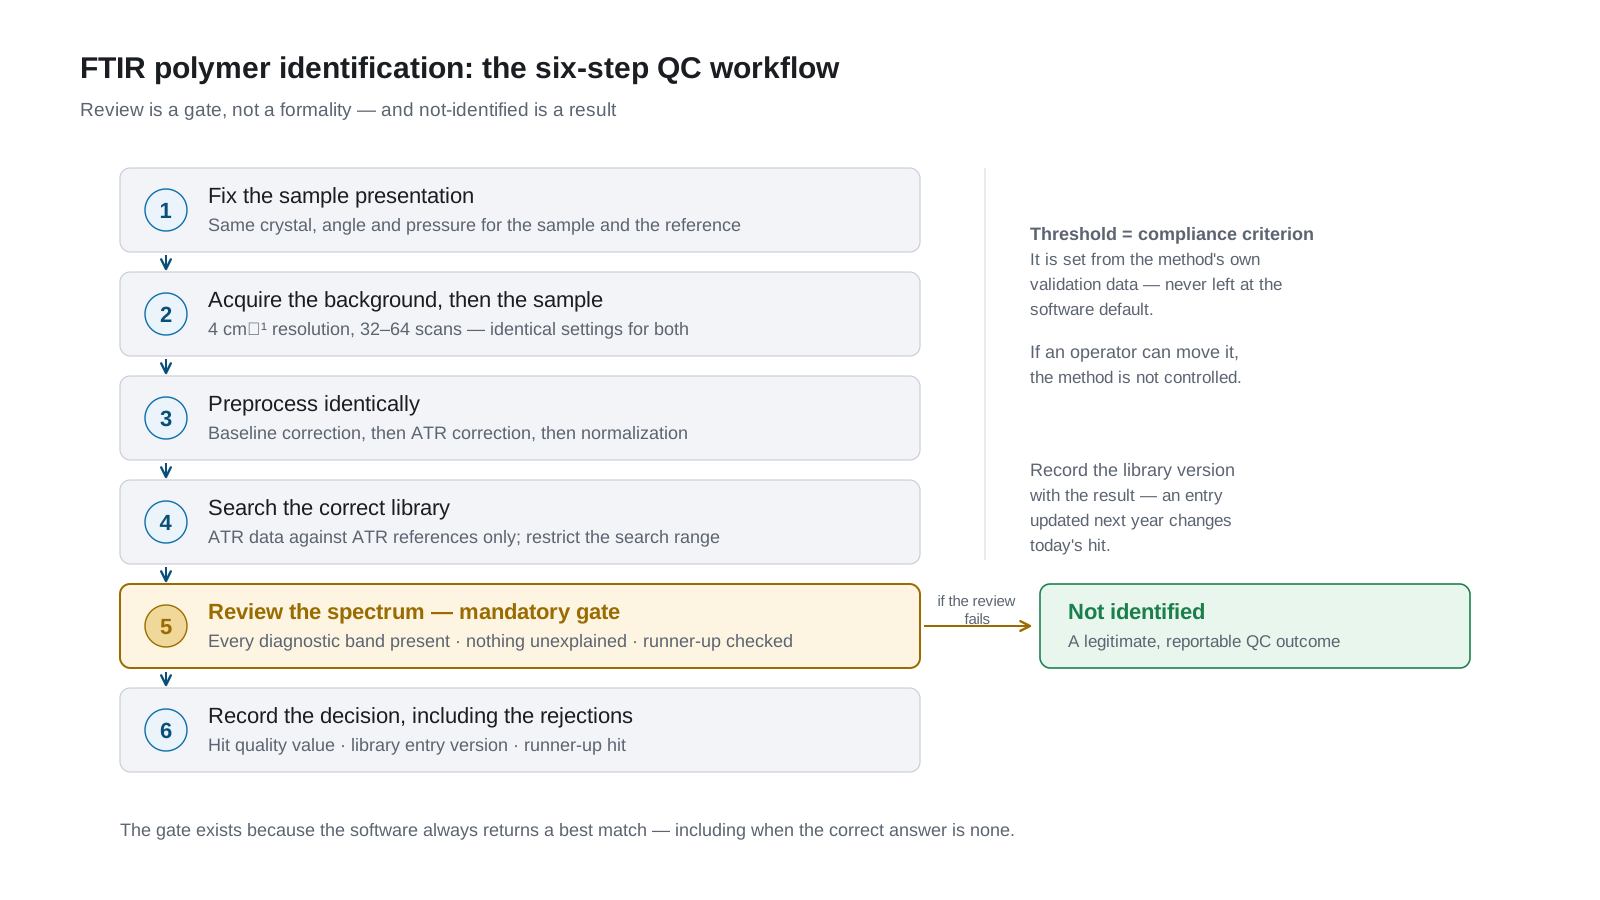
The workflow below is written as it would appear in a work instruction. Steps 1 and 6 are where most identifications are lost.
- Fix the sample presentation. Take the pellet, granule, moulding or film as received; flatten a rough surface, clean it with ethanol and dry it. Record in the method that the same crystal, angle and pressure setting apply to sample and reference.
- Acquire the background on a clean crystal, then the sample, at a fixed resolution and scan count. A 4 cm⁻¹ resolution with 32–64 co-added scans is normal for polymer work; changing either between reference and sample invalidates the comparison.
- Preprocess identically, always. Baseline correction, then the ATR correction the method specifies, then normalization. This belongs in the method, not in the analyst’s head.
- Search the correct library. Match ATR against ATR. Restrict the range to the region the method defines rather than the full 7,800–350 cm⁻¹ span, so a noisy far end cannot carry weight.
- Read the hit list, do not accept its first line. Confirm every diagnostic band for the proposed polymer is present, no unexplained band is present, and the runner-up is not a plausible alternative.
- Record the decision, including the rejections. “Not identified, no library entry above the method threshold” is a legitimate QC outcome. A forced identification is not.
Where a Polymer QC FTIR Workflow Fails
Almost every failure traces back to step 5 or step 6, because both require a person. A first-line hit is accepted because it looks right; a rejection is recorded as an anomaly to be resolved later and then never resolved. Neither is a hardware problem. What fixes them is making the spectral review a recorded step with the same status as the measurement, and having the method permit “not identified” as an outcome.
Reading a Spectrum in Polymer QC: FTIR Bands That Carry the Decision
Eight families account for most incoming inspection work. The bands below are the ones that carry the decision; wavenumbers are given as commonly reported in the literature and will drift by a few cm⁻¹ between instruments and sampling modes [9][10].
| Polymer family | Most useful diagnostic bands (cm⁻¹) | What actually separates it from its neighbours |
|---|---|---|
| PE (LDPE, LLDPE, HDPE) | 2,915; 2,848; 1,470; 720 | Only two C–H stretching bands and no methyl band. A 1,377 cm⁻¹ peak means the material is not polyethylene. |
| PP homo- and copolymer | 2,950; 2,917; 2,873; 1,456; 1,377; 1,167; 973 | The methyl deformation near 1,377 cm⁻¹ is the discriminator against PE. Copolymer grades add an ethylene-related shoulder. |
| PS and styrenic blends | 3,025; 1,600; 1,493; 1,452; 758; 699 | The out-of-plane aromatic pair at 758 and 699 cm⁻¹. Their intensity ratio distinguishes PS from styrenic copolymers. |
| PVC, rigid and plasticised | 2,970–2,911; 1,426; 1,334; 1,254; 1,099; 962; 693; 614 | Multiple C–Cl bands between 700 and 600 cm⁻¹. A strong ester carbonyl near 1,730 cm⁻¹ signals plasticiser, not the polymer. |
| PET | 1,715; 1,504; 1,453; 1,408; 1,241; 1,102; 1,015; 723 | The ester carbonyl near 1,715 cm⁻¹ with an aromatic ring pattern; the 723 cm⁻¹ band confirms the terephthalate unit. |
| PA 6 and PA 66 | 3,299; 2,934; 2,858; 1,633; 1,540; 1,473; 1,276 | The amide I / amide II pair near 1,633 and 1,540 cm⁻¹ with the N–H band near 3,299 cm⁻¹. |
| PC | 1,776; 1,598; 1,406; 1,229; 1,192; 1,082; 830 | A carbonyl well above 1,750 cm⁻¹ together with the aromatic ring bands separates PC from PET. |
| PMMA | 1,730; 1,443; 1,378; 1,268; 1,240; 1,150; 755 | An ester carbonyl close to PET’s, resolved by the absence of aromatic bands and the C–O–C pattern near 1,150 cm⁻¹. |
The Misidentifications FTIR Plastic Analysis Actually Produces
The errors worth designing against are known and repeatable. A study that tested infrared identification against a range of natural objects found fish and squid lenses, beaks, bones, skin and feathers all being returned as polymers, and warned that surface degradation and biofouling push polyamide and keratin toward each other [11].
| What appears | Why it happens | What prevents it |
|---|---|---|
| Polyamide returned for a protein or keratin sample | Amide I and amide II bands sit in the same positions in proteins and in nylons | Never accept a PA hit on a sample of biological origin without a second technique |
| PVC returned for a plasticised vinyl | The polymer bands are present but the plasticiser dominates the ester region | Report the plasticiser as a separate finding rather than letting it drive the hit ranking |
| PE returned for a wax, grease or release agent | Long methylene chains give the same two C–H bands as polyethylene | Compare intensities, not just positions, and check for a 1,377 cm⁻¹ methyl band |
| A cross-linked or heavily filled part returned as “no match” | Filler bands (carbonate near 1,425 cm⁻¹, silicate near 1,100–1,000 cm⁻¹) and reduced polymer signal | Treat the inorganic pattern as a filler identification and identify the polymer from the bands that remain |
| An aged part identified as a different polymer | Oxidation adds a carbonyl band and broadens the C–H region | Compare against an aged reference, or check the carbonyl region separately as a degradation indicator |
| A laminate identified as its coating | ATR probes only the outer few micrometres | Section the part, or identify the layers separately |
| Confident-looking wrong answer at a high hit score | A library entry acquired with different preprocessing or a different crystal | Match sampling mode, then review the spectrum overlay |
Match Thresholds in FTIR Polymer Identification: Why One Number Cannot Work
Every library search returns a score, and most laboratories inherit a single cut-off — 0.90, 0.95, sometimes 0.80 — from whoever commissioned the instrument. The published record does not support that approach, and the standard that used to guide it is gone.
What the literature actually reports
| Source | What it says about thresholds |
|---|---|
| Survey of 86 infrared identification studies | No common agreement: reported thresholds ranged from 60 % to 93 %, most between 70 % and 85 %; 49 of the FTIR studies stated no threshold at all [11] |
| Multipolymer ATR identification method validated against true- and false-positive rates | Thresholds derived to hold a true-positive rate above 95 % and a false-positive rate below 5 % came out above the 0.6 value used by many references that do not quantify uncertainty 12 |
| TGA-FTIR polymer identification with machine-learning cross-check | An empirical threshold of r > 0.7 was adopted for positive matches 13 |
| ASTM E2310, the guide for spectral searching by curve matching | Withdrawn in 2024, having stated that spectral searching is a screening aid and does not replace expert interpretation [4] |
Read those rows together and the conclusion is uncomfortable but useful: a match score is a ranking, not a verdict. The ASTM guide that once defined the practice is withdrawn, so a laboratory cannot point to a standard for its cut-off. What it can point to is its own validation data.
Setting a Match Threshold You Can Defend
There is one defensible route, and it is the one the published method uses [12]: fix the true-positive rate you require, measure the false-positive rate that follows, and write both into the method. Acquire spectra of at least twenty confirmed samples of each polymer you identify, search them against your own library, record the score distribution, and set the cut-off at the fifth percentile of the true-positive distribution. Then test that cut-off against other polymers and against non-polymer materials, and record how often they exceed it. Reporting those two numbers beside the threshold is what turns a software setting into a method decision.
Two consequences follow. Thresholds differ between polymers — one whose spectrum is two strong bands needs a tighter cut-off than one with a rich fingerprint region. And the score never replaces inspection of the spectrum: the natural-material false positives above were all produced by a machine ranking rather than by a chemist.
Building an FTIR Library for Polymer QC
The library is the method. Everything the instrument concludes traces back to the spectra inside it, so provenance matters more than size.
What Belongs in the Library, and What to Leave Out
| Library content | Why it earns a place |
|---|---|
| In-house references built from characterised material — supplier certificate, datasheet, known grade | This follows the model used by the material-specific identification standards, where an unknown is compared against the confirmed spectrum of a known material rather than a generic entry 3 |
| References acquired on the same accessory and method as the samples | A library assembled from mixed sources ranks on optical differences instead of chemistry |
| The variants the site actually receives: LDPE, LLDPE and HDPE separately; PP homopolymer and the copolymer grades purchased; aged and stabilised recyclate | Grade-level variation within one polymer family is where identification quietly fails |
| The additives that dominate the bands: plasticisers, calcium carbonate, talc, glass fibre, mold-release agents, plus a deliberately oxidised sample of each major polymer | These explain the bands that would otherwise be read as contamination |
| Nothing whose provenance cannot be stated | A convenient entry nobody has validated can still win a search, and is worse than no entry |
Library Control
Record who added each entry and when, remove entries acquired with a discarded crystal, and re-run the threshold validation whenever the library changes: a library is a controlled document, not a collection. When ageing is part of the question rather than a nuisance, the methodology for assessing polymer photoageing by infrared is the subject of its own standard and is the right reference to cite 6. Where elastomers or thermoplastic elastomers are in scope, the identification standard itself has just been rewritten: ISO 4650:2012 was withdrawn on 28 July 2026 and replaced by ISO 4650:2026, a fourth edition that adds ATR to the methods it specifies while remaining explicitly qualitative 5.
Where FTIR Plastic Analysis Ends and Other Tests Begin
FTIR answers identity. Four adjacent questions come up in the same FTIR plastic analysis review, and each needs a different instrument.
| Question | What answers it | Why the FTIR spectrum cannot |
|---|---|---|
| Is the grade right, not just the polymer? | Melt flow index tester to ISO 1133 | Two grades of one polymer are spectroscopically indistinguishable |
| What is the thermal behaviour? | Differential scanning calorimeter | Melting range and crystallinity are not a vibrational property |
| How much filler or carbon black is present? | Carbon black content tester | FTIR detects a filler’s presence, not its loading |
| Is the part still fit for service? | Vicat softening temperature / HDT tester and an impact tester | Identity is not performance |
For polyethylene pipe grades the pairing is well established: identification on receipt, then long-term performance by hydrostatic pressure testing. Our plastic pipe testing standards guide maps where each test sits, and the ISO 1133 melt flow index guide covers the grade check in detail.
Choosing an FTIR for Polymer Identification Work
Polymer identification is one of the least demanding mid-infrared applications, so a specification written for a research instrument wastes budget — and one written only around resolution can miss the features that decide throughput. The sampler decides how fast an identification is made; the library and its search decide how much of it you can trust.
What to Specify on a Polymer Identification Station
| Capability | Why it decides whether the station works in QC |
|---|---|
| A single-reflection diamond ATR as the default sampler | No sample preparation, no consumables, and it survives hard, abrasive granules. ZnSe is the value alternative where samples are soft or dissolved. |
| A fixed, recallable method per material family | The operator selects “PE – incoming” and gets the same acquisition, preprocessing and threshold every time. A parameter that can be varied by hand will be. |
| Preprocessing and threshold control the operator cannot change | The threshold is the method’s compliance criterion. If it lives in a user-editable setting, the method is not controlled. |
| A user-built library with import and export | The reference spectra you paid to characterise must be able to enter the instrument and leave it in a form you can archive. |
| A reported hit quality value, not just a hit name | A QC record needs the score, the library entry version and the runner-up. |
| A documented verification procedure | Wavenumber accuracy, resolution and baseline stability should be checkable on site against a reference film. |
Our FTIR range covers this work from a portable field unit to a research bench instrument. Published specifications relevant to identification are summarised below; the full pages are linked.
| Model | Published range, resolution and SNR | ATR sampling as published | Form |
|---|---|---|---|
| BRT-8 Plus | 7,800–350 cm⁻¹, 0.85 cm⁻¹, SNR > 50,000:1 | Single-reflection diamond or ZnSe ATR modules, tool-free | Portable, 7 kg |
| BRT-800 | 7,800–350 cm⁻¹, 0.85 cm⁻¹, SNR > 30,000:1 | Modular ATR and gas-cell interfaces, optional battery | Portable, 7 kg |
| BRT-850 | 7,800–375 cm⁻¹, 1 cm⁻¹, SNR > 30,000:1 | Tool-free accessory positioning | Benchtop, 14 kg |
| BRT-860 | 7,800–350 cm⁻¹, better than 1 cm⁻¹, SNR > 30,000:1 | Tool-free accessory recognition | Benchtop, 14 kg |
| BRT-890 | 7,800–350 cm⁻¹, better than 0.85 cm⁻¹, SNR > 45,000:1 | Quick-release diamond or ZnSe ATR modules | Benchtop, 19 kg |
FTIR spectrometer range and quotation — or review the FTIR spectrometer selection guide for the transmission-versus-ATR decision, and the ATR crystal comparison for the crystal choice behind the sampler.
Verifying an FTIR Before It Enters Routine Polymer QC Work
An identification station should be accepted against the method it will run, not against the supplier’s demonstration. The checks below follow the general practice for obtaining infrared spectra for qualitative analysis and for internal reflection spectroscopy 12.
| Check | Reference material or artefact | Acceptance criterion |
|---|---|---|
| Wavenumber accuracy | Polystyrene film, 1,601.4 cm⁻¹ and 906.7 cm⁻¹ bands | Agreement with the method’s stated tolerance at both ends of the range |
| Resolution | Polystyrene film band separation at the method’s resolution setting | Bands resolved to the method’s specification |
| Baseline stability and noise | 100 % line over the method’s scan count | Peak-to-peak noise inside the method’s limit at the same resolution |
| ATR sampling repeatability | The same pellet measured five times, repositioned each time | Band position repeatable and intensity scatter inside the method’s limit |
| Library and search behaviour | A characterised sample of each polymer the site identifies | Correct polymer ranked first, with the score recorded |
| Threshold behaviour at the edges | One known sample per polymer, plus one non-polymer | Known samples above the threshold; non-polymer below it |
| Method control | Operator account review | Acquisition, preprocessing and threshold settings not editable at operator level |
| Documentation | Verification certificates, method sheets, library version | Filed before routine use |
Six questions are worth putting to any supplier in writing, because a negative answer is only a problem if you discover it after purchase:
| Question |
|---|
| Which ATR crystal is supplied as standard, and what is the spare-plate price and lead time? |
| Can the search threshold be locked at method level so an operator cannot change it? |
| Can reference spectra be imported, and can the library be exported in full for archiving? |
| Does the report include the library entry version, the hit quality value and the runner-up hit? |
| Which reference film and procedure are supplied for on-site wavenumber and resolution verification? |
| What is the stated resolution and SNR at the method’s settings — not at the best-case settings? |
Frequently Asked Questions
What is FTIR polymer identification?
FTIR polymer identification is the use of infrared spectroscopy to establish which polymer a plastic sample is made of, by matching its absorption bands against reference spectra. The spectrum shows which bonds are present and in which chemical context, which separates polyethylene from polypropylene, PET from polycarbonate, and nylon from a protein. In a QC workflow the result is recorded as a library hit with a hit quality value and a pass or fail against a documented threshold. It confirms identity, not grade.
Can FTIR plastic analysis tell PE from PP?
Yes, reliably, and the discriminator is a single band. Polypropylene carries a methyl deformation band near 1,377 cm⁻¹ that polyethylene lacks, while polyethylene shows two C–H stretching bands near 2,915 and 2,848 cm⁻¹ with a methylene bend near 1,470 cm⁻¹ and a rocking band near 720 cm⁻¹. The two cannot be confused when the whole 1,500–1,300 cm⁻¹ region is reviewed, which is why the review step is not optional.
Why does my FTIR result not match the supplier’s certificate?
Usually because the two laboratories did not run the same measurement. Penetration depth falls with wavenumber, so ATR spectra carry stronger low-wavenumber bands than transmission spectra, and strong bands shift and become asymmetric in ATR through anomalous dispersion. Contact pressure changes intensity again. A certificate quoting transmission data and a receiving lab measuring by ATR are not producing the same spectrum, and the difference is optical rather than chemical.
What hit quality index should a polymer QC laboratory use?
There is no defensible universal number. A survey of 86 infrared identification studies found reported thresholds from 60 % to 93 %, mostly between 70 % and 85 %, and nearly half the FTIR studies published no threshold at all. The ASTM guide for spectral searching was withdrawn in 2024, so no current standard supplies a figure. Set it in-house: measure confirmed samples of each polymer, take the fifth percentile of the true-positive score distribution, then test that cut-off against other polymers and record the false-positive rate.
Is ATR or transmission better for identifying plastics?
ATR is the better default for polymer QC because it needs no sample preparation, works on pellets, mouldings and films, and cleans in seconds. Its limitation is that it probes only the outer few micrometres, so it can identify a coating instead of the part. Transmission suits thin films where bulk composition matters, and remains the reference technique for library comparison. Whichever route a laboratory chooses, samples and references must be acquired the same way.
Why does my library search return a natural material as a plastic?
Because the ranking comes from an algorithm, not a chemist. A published test of infrared identification against natural objects found fish and squid lenses, beaks, bones, skin and feathers all being returned as polymers, and noted that surface degradation and biofouling push polyamide and keratin toward each other. The remedy is procedural: require the analyst to confirm that every diagnostic band is present and none is unexplained before a result is released.
How many reference spectra does an identification library need?
Enough to cover the variants the site actually receives, acquired on the same accessory and method as the samples. That means separate entries for LDPE, LLDPE and HDPE rather than one polyethylene entry, homopolymer and copolymer grades of polypropylene, and entries for the additives that dominate the bands — plasticisers, calcium carbonate, talc and glass fibre. Library size is not a quality measure; provenance and method consistency are, and every entry should record who added it and when.
Does an FTIR result have to be confirmed by a second technique?
For identity alone, no: a spectrum with all diagnostic bands present, searched against an ATR reference library with a validated threshold, is a defensible identification. A second technique is needed when the question goes beyond identity — melt flow rate for grade, calorimetry for thermal behaviour, thermogravimetry for filler loading. Confirmation is also warranted for blends, laminates, aged parts and samples of biological origin, because those are the cases the survey data show producing false identifications.
Conclusion: The Workflow in Six Decisions
Identity is the easy half. The work is in the decisions around it.
- Write the method before the first sample. Fix the sampler, resolution, scan count, preprocessing and search range, and change none of them per sample.
- Build the library from characterised material on your own accessory. A mixed-provenance library ranks on optics, not chemistry.
- Set the threshold from your own data. Take the fifth percentile of the true-positive distribution, measure the false-positive rate against everything else, and put both numbers in the method.
- Lock the method at account level. If an operator can move the threshold, the method is not controlled.
- Make spectral review mandatory. The withdrawn ASTM guide and the natural-material false positives point the same way: a score ranks, a chemist decides.
- Pair identification with the tests it cannot replace — melt flow rate for grade, calorimetry for thermal behaviour, filler analysis for loading.
Ready to specify a station? Send us the polymer families you identify and your throughput and we will confirm the sampler, resolution, library scope and verification documentation. Instrument: BRT-890 FTIR spectrometer, in the FTIR spectrometer category.
About the author. This guide was prepared by the applications engineering team at Shenyang Baoruitong Automation Equipment Co., Ltd. (BRT Testing), a manufacturer of analytical and materials-testing instrumentation. Learn more about our testing work.