- How a UV/Vis Spectrophotometer Works
- Single Beam vs Double Beam: The Core Difference
- The Eight Specifications That Decide Your Purchase
- Matching the Instrument to Your Application
- The BRT Testing UV/Vis Range: How 16 Models Map to These Tiers
- Accessories and Hidden Costs to Budget For
- Seven Common Buying Mistakes
- How to Verify a UV/Vis Spectrophotometer Before You Buy
- Frequently Asked Questions
- Conclusion: Start From the Application, Then Buy the Optics
UV/Vis Spectrophotometer Buying Guide: Single vs Double Beam
The short answer: buy a single-beam UV/Vis spectrophotometer for teaching, fixed-wavelength colorimetric checks and low-throughput QC — it is the most cost-effective way to get accurate absorbance readings. Buy a double-beam instrument if you need spectral scanning, kinetics, long unattended runs, multi-sample batches, or pharmacopoeia-regulated testing, because double-beam optics cancel lamp drift in real time. Every other decision in this spectrophotometer selection guide — wavelength range, spectral bandwidth, stray light, accuracy — is simply a matter of matching numbers to your method.
That distinction explains most of the price gap between a $2,000 benchtop unit and a research-grade spectrometer. It is also the most common source of buyer’s remorse: labs that buy single-beam and later discover they need kinetics, or labs that over-pay for dual-beam optics when a 4 nm single-beam instrument would have run their COD test perfectly for a decade.
This guide walks through the optics, the eight specifications that actually decide performance, and a tier-by-tier mapping of the 16 UV/Vis and visible spectrophotometer models in the BRT Testing range.
How a UV/Vis Spectrophotometer Works
A UV/Vis spectrophotometer measures how much light a sample absorbs as a function of wavelength. The measurement obeys the Beer–Lambert law:
A = ε × b × c
where A is absorbance, ε is molar absorptivity, b is the path length through the sample, and c is concentration. Because absorbance is directly proportional to concentration, a calibrated instrument converts an optical reading into a quantitative result. The European Pharmacopoeia defines absorbance formally as the logarithm to base 10 of the reciprocal of transmittance, A = log₁₀(I₀/I), where I₀ is incident and I is transmitted intensity (Ph. Eur. 2.2.25).
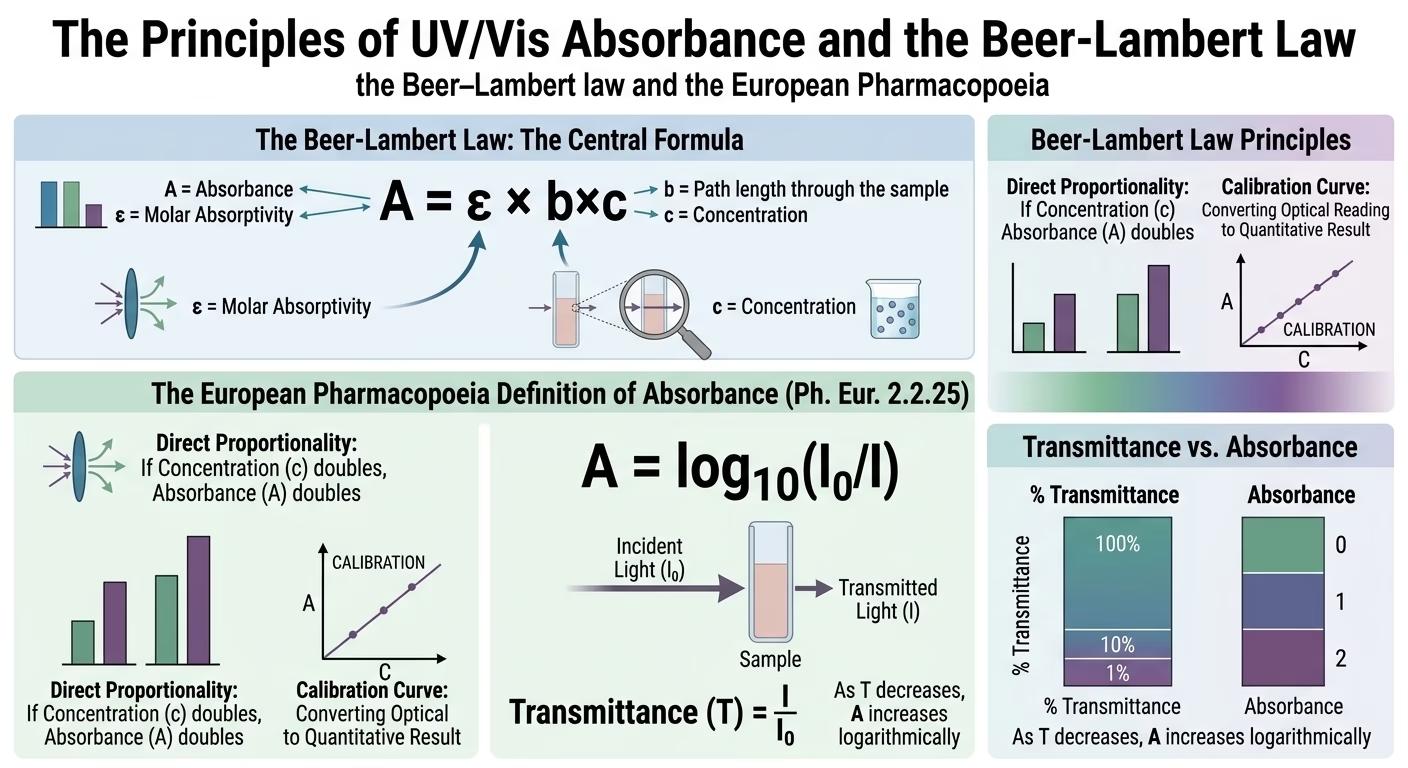
introduce Beer–Lambert law
The light path is always the same five blocks:
- Light source — a deuterium lamp covers the ultraviolet region, a tungsten-halogen lamp the visible.
- Monochromator — a diffraction grating with entrance/exit slits selects a narrow wavelength band. The Czerny–Turner (C-T) geometry is standard; grating density (1200 or 1600 lines·mm⁻¹) sets achievable resolution.
- Sample compartment — holds the cuvette; volumetric standards assume a 10 mm path length.
- Detector — a silicon photodiode or photomultiplier tube (PMT) converts transmitted light into a signal.
- Signal processing — converts the raw ratio into %T, absorbance or concentration.
Wavelength coverage is the first filter in any buying decision, because it determines which analytes you can measure at all:
| Region | Wavelength | What it unlocks |
|---|---|---|
| Near-UV | 190–240 nm | Nitrate, nitrite, HPLC detection, some APIs |
| UV | 240–340 nm | Nucleic acids (260 nm), proteins (280 nm), most pharmaceutical assays |
| UV–Vis boundary | 340–400 nm | Colour-forming reagents, potassium dichromate checks |
| Visible | 400–700 nm | COD, ammonia, phosphate, metals after digestion, food colour, Bradford/BCA protein assays |
| Near-IR tail | 700–1100 nm | Turbidity, some inorganic complexes, instrument self-checks |
Note the terminology trap: the European Pharmacopoeia defines the UV region as 180–400 nm and the visible region as 400–800 nm (Ph. Eur. 10th Edition, mandatory since 1 January 2020). A “UV/Vis” instrument that only reaches 325 nm will fail a nucleic-acid quantification method; a “visible” instrument that reaches 325 nm is perfectly adequate for COD and ammonia.
Single Beam vs Double Beam: The Core Difference
Both configurations use the same light source, monochromator and detector. They differ in how many light paths travel through the sample compartment — and therefore in whether the instrument can correct for its own drift.
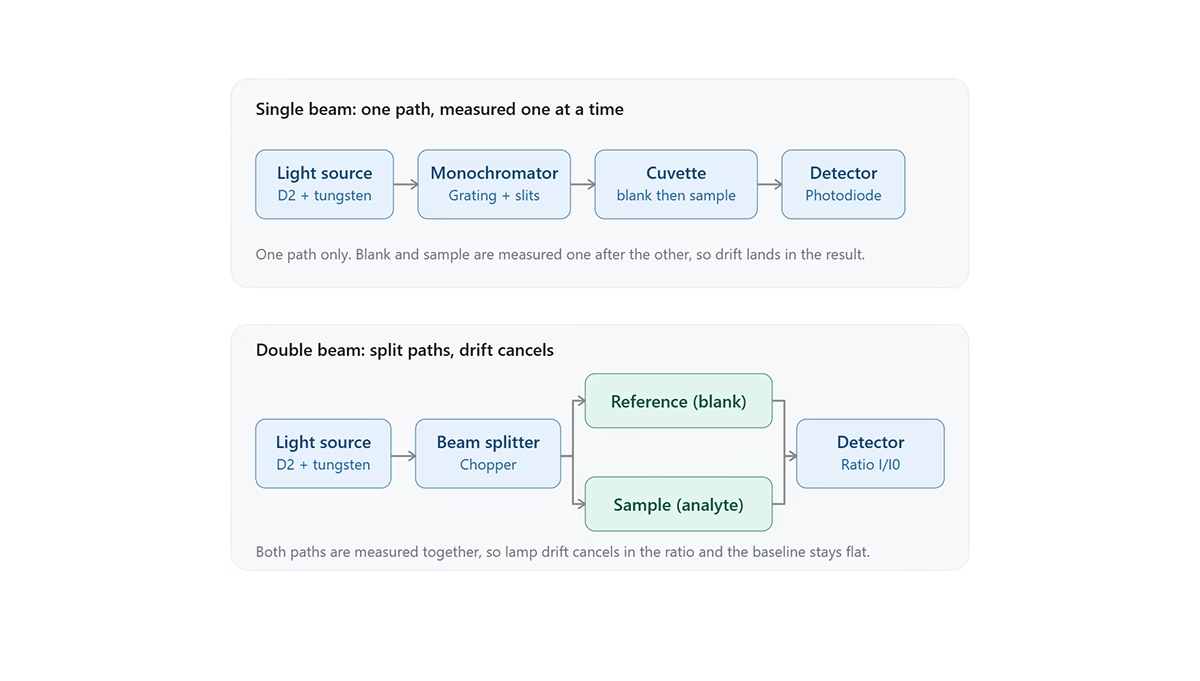
Comparison diagram of the optical paths of single-beam and double-beam UV-Vis spectrophotometers
How a single-beam instrument measures
A single-beam spectrophotometer sends one beam of monochromatic light through the sample compartment. It performs two sequential measurements:
- Blank correction: record the sample-beam intensity through the blank,
S_Blank - Sample measurement: record the sample-beam intensity through the sample,
S_Meas
Transmittance is then calculated as %T = (S_Meas / S_Blank) × 100.
The weakness is temporal. If the lamp output or detector sensitivity changes between the two measurements, that change is baked into the result. Shimadzu’s technical note UV Talk Letter Vol. 9 (October 2012) gives the arithmetic: measuring a 40 %T sample when the source intensity has fallen to 90 % of its level at blank correction yields 36 %T instead of 40 %T. On a 4 AU scale that is a systematic error far larger than most pharmacopoeia tolerances.
The practical consequences are well documented in the same note: single-beam systems “require waiting until the system stabilizes before starting measurements” — typically one to two hours after switching the power on — and they need frequent re-zeroing when you change wavelength or measure over long periods.
How a double-beam instrument measures
A double-beam spectrophotometer splits the monochromatic beam into a sample beam and a reference beam before it enters the sample compartment. Both beams are measured essentially simultaneously, and the instrument computes the ratio of ratios:
%T = (S_Meas / R_Meas) / (S_Blank / R_Blank) × 100
Because lamp decay, mains voltage fluctuation, and ambient temperature change affect both beams identically, they cancel out of the ratio. The result is a flat baseline, low noise, and stable long-duration scans — which is why double-beam optics are the reference configuration in regulated pharmaceutical QC.
There is a second-order benefit most buyers miss: because drift is compensated rather than waited out, double-beam instruments need far less warm-up time, which raises daily sample throughput and extends lamp life.
Single beam vs double beam UV Vis — side-by-side
| Feature | Single Beam | Double Beam |
|---|---|---|
| Optical path | One beam; blank and sample measured sequentially | Two beams; sample and reference measured simultaneously |
| Drift compensation | None — source/detector drift enters the result | Automatic, real-time |
| Baseline stability | Requires frequent re-zeroing | Flat baseline, low drift |
| Warm-up time | Typically 1–2 hours (Shimadzu) | Minutes |
| Scan speed | Slower — baseline re-run per scan | Faster; scan without manual baseline correction |
| Kinetics / time-course | Possible but drift-limited | Designed for it |
| Batch throughput | One sample at a time | Supports multi-cell changers (e.g. automatic 8-cell) |
| Wavelength accuracy (typical) | ±1 to ±2 nm on entry models; ±0.5 nm on 2 nm models | ±0.3 nm |
| Spectral bandwidth (typical) | 4 nm entry / 2 nm mid | 1.8 nm standard / 1.0 nm research |
| Stray light (typical) | ~0.1–0.3 %T | ≤0.05 %T, down to ≤0.015 %T on research models |
| Unit cost | Low | Moderate to high |
| Maintenance | Minimal, simple optics | More optics to align and service |
| Best fit | Teaching, fixed-wavelength colorimetry, low-throughput QC | Pharma QC, method development, research, kinetics, regulated work |
Choose single beam when: you measure at fixed, pre-validated wavelengths; measurement sessions are short; you do not need full spectra; and your budget or bench space is limited.
Choose double beam when: you scan complete spectra; you run long or unattended sequences; you need the highest photometric accuracy; you are preparing for GLP/GMP audits; or your sample volume exceeds roughly 20 readings a day — at that point the throughput gain starts to pay for the optics.
The Eight Specifications That Decide Your Purchase
Wavelength range alone tells you nothing about data quality. These eight parameters, ranked by how often they cause a failed validation or a rejected batch, are what a spectrophotometer selection guide should actually compare.
1. Wavelength range
Establish your analytes’ absorption maxima first. 190–1100 nm is the practical full-range specification for a UV/Vis instrument. Models that start at 200 nm cannot measure below 200 nm; models that stop at 1000 nm have no margin above the visible region. If you only ever measure colour-forming visible reactions, a 325–1100 nm visible-only instrument saves both money and bench space.
2. Spectral bandwidth (SBW)
Spectral bandwidth is the width of the wavelength band that reaches the detector, set by the slit and grating. Narrower bandwidth means higher resolution — the ability to separate two closely spaced absorption peaks.
- 4 nm — adequate for fixed-wavelength colorimetric assays where the peak is broad (COD, ammonia, most visible chemistry)
- 2 nm — the practical pharmacopoeia standard; USP notes that 2 nm SBW is sufficient for most quantitative work, with tighter bandwidth needed only for very sharp bands
- 1.8 nm — standard on double-beam instruments; delivers noticeably cleaner spectra
- ≤1.0 nm — research grade. The NIST SRM 2034 holmium oxide wavelength standard is certified only for instruments with nominal SBW
≤3 nm, and the sharpest certified bands shift noticeably at bandwidths above 1 nm
If your method quantifies a compound whose spectrum has a narrow maximum, or if a formulation contains excipients with overlapping spectral features, bandwidth is a hard requirement, not a preference.
3. Wavelength accuracy and repeatability
Wavelength accuracy is the difference between the wavelength your instrument reports and the true wavelength; repeatability is the standard deviation of repeated measurements at the same nominal wavelength.
Ph. Eur. 2.2.25 permits ±1 nm in the UV range and ±3 nm in the visible range for the absorption maxima of holmium perchlorate, mercury vapour lines, or hydrogen/deuterium emission lines. USP General Chapter <857> is stricter and is the benchmark most multinational QC labs work to:
| Parameter | Range | Acceptance criterion (USP <857>) |
|---|---|---|
| Wavelength accuracy | 200–400 nm | ±1 nm |
| Wavelength accuracy | 400–900 nm | ±2 nm |
| Wavelength precision | 200–900 nm | SD ≤0.5 nm |
Both chapters require the verification to be performed with at least six replicate measurements across the operational range. In practice, buy ±0.3 nm if you do qualitative identification, spectral comparison or method transfer between instruments; ±1 to ±2 nm is acceptable for routine fixed-wavelength assays.
4. Photometric (absorbance) range and accuracy
This is the range over which the instrument’s response is linear with concentration, plus how closely it agrees with a reference.
- Typical working range: 0–200 %T and −0.301 to 3.000 Abs on mainstream models; research-grade instruments extend to ±4.000 Abs.
- Accuracy: USP
<857>accepts a mean deviation of ±0.010 AU for certified values below 1.00 AU, and ±1.0 % of the certified value above 1.00 AU. Photometric precision must not exceed 0.005 AU standard deviation below 1.00 AU. Ph. Eur. 2.2.25 uses a flat ±0.01 tolerance for its potassium dichromate check. - Practical ceiling: Ph. Eur. states that quantitative measurements relying on absorbance values above 2.0 should be avoided. If a specification promises 4.000 Abs, confirm the stray-light figure that makes it meaningful.
5. Stray light
Stray light is unwanted radiation that reaches the detector from outside the selected bandwidth. It is the single most important hidden specification in UV/Vis, because it is the primary cause of deviation from the Beer–Lambert law at high absorbance — the instrument reads a plateau that looks like a valid result.
The USP <857> operational qualification specifies cut-off filter solutions to quantify it at defined wavelengths:
| Cut-off solution | Verification wavelength | Spectral range covered |
|---|---|---|
| Aqueous potassium chloride (12 g/L) | 198 nm | 190–210 nm |
| Aqueous sodium iodide or potassium iodide (10 g/L) | 220 nm | 210–270 nm |
| Acetone | 300 nm | 250–330 nm |
| Aqueous sodium nitrite (50 g/L) | 340 nm | 300–400 nm |
Above 400 nm, USP does not require stray-light evaluation. As a rule of thumb: ≤0.3 %T is entry-level, ≤0.05 %T is high-precision double-beam territory, and ≤0.015 %T indicates a research-grade instrument. If you routinely measure high-absorbance samples, pay for stray light rather than wavelength range.
6. Baseline stability and drift
Baseline drift is the change in reading over time with no sample present. It governs how long you can scan, how long a kinetics run can last, and how often you must re-zero. Double-beam instruments commonly quote drift of ≤0.001 Abs/30 min together with a baseline flatness specification. If a datasheet does not state drift, assume it is unremarkable.
7. Light source, detector and consumable cost
- Deuterium lamp — covers the UV region; a consumable with finite life, so ask for rated hours and replacement price before you order.
- Tungsten-halogen lamp — covers the visible region; the “plug-in” socketed designs on mid-range and high-end models reduce service downtime.
- Silicon photodiode — standard, robust, low cost, well matched to visible and near-UV work.
- Photomultiplier tube (PMT) — much higher sensitivity, used in research-grade instruments where low-light-level detection at narrow bandwidth matters. PMT instruments are typically heavier and significantly more expensive.
8. Data storage, connectivity and compliance software
A spectrophotometer is a regulated data source in a GxP environment, so the documentation features are not optional extras:
- On-board storage — 200 data points or calibration curves is now the baseline; some models add curve libraries (100 curves) or accept an 8 GB USB stick for method and data transfer.
- Interfaces — USB plus a parallel/LPT port for direct printing is standard on benchtop models; confirm the host software you actually plan to use.
- GLP/GMP software — audit trails, user access levels, electronic signatures, and method lock-down are mandatory if you work under 21 CFR Part 11 or an equivalent national regime.
- Methods moving to regulated use — ICH Q2(R2) Validation of Analytical Procedures has been effective since 14 June 2024 and anchors the validation and system-suitability expectations for analytical procedures in regulated submissions. Buy documentation, not just hardware.
Matching the Instrument to Your Application
The fastest route to a shortlist is to start from the application, not the specification sheet.
| Application | Must-have specification | Recommended configuration |
|---|---|---|
| University teaching, student practicals | Fixed wavelength, 4 nm SBW, simple display | Single beam, 4 nm, 200–1000 nm |
| Water & wastewater (COD, ammonia, nitrate, phosphate) | Visible range, 4 nm SBW, stable blanks | Single beam visible (325–1100 nm) or single beam UV/Vis |
| Food & beverage (colour, vitamins, adulterant screening) | Visible range, 2 nm SBW for colour measurement | Single beam UV/Vis 2 nm, or visible-only 2 nm |
| Environmental / trace analysis | Low stray light, 2 nm SBW, UV coverage to 190 nm | Single beam or entry double beam, 2 nm |
| Pharmaceutical QC & release testing | ±0.3 nm accuracy, ≤0.05 %T stray light, GLP software | Double beam, 1.8 nm |
| Dissolution & content uniformity | Multi-cell automation, reproducible cell positioning | Double beam with automatic 8-cell changer |
| Method development & spectral identification | Full spectrum scanning, narrow SBW, low stray light | Double beam, 1.8 nm, extended absorbance range |
| Life sciences (DNA/RNA at 260 nm, protein at 280 nm) | UV coverage to 190 nm, micro-volume or short-path cells | Single beam or double beam, 2 nm or better |
| Kinetics / enzyme assays | Flat baseline over time, no re-zeroing | Double beam, 1.8 nm |
| Trace-level research, sharp-band work | ≤1.0 nm SBW, PMT detector, stray light ≤0.015 %T | Research-grade double beam |
| Plating, pigments, inks, dyestuffs | Visible only, 2 nm, robust optics | Single beam visible, 2 nm |
| Structural identification / additive analysis | Molecular fingerprinting, not absorbance quantitation | FTIR, not UV/Vis — see the FTIR spectrometer range |
The BRT Testing UV/Vis Range: How 16 Models Map to These Tiers
BRT Testing builds the UV/Vis family in four performance tiers plus a dedicated visible-only line, so the selection reduces to identifying your tier.
Tier 1 — Entry and routine testing: single beam, 4 nm
| Model | Range | SBW | Accuracy | Repeatability | Display | Weight |
|---|---|---|---|---|---|---|
| BRT-1100UV | 200–1000 nm | 4 nm | ±2 nm | ≤1 nm | Large LCD | 14 kg |
| BRT-1150UV | 190–1050 nm | 4 nm | ±1.5 nm | ≤0.5 nm | 3.2″ TFT colour (400×240) | 14 kg |
| BRT-1200UV | 200–1000 nm | 4 nm | ±2 nm | ≤0.5 nm | LCD | 14 kg |
All three offer 0–200 %T, −0.301 to 3.000 Abs, a dual light source (tungsten-halogen plus imported deuterium lamp) and 200 stored data points/curves with USB plus parallel printing. Use them for teaching laboratories, routine colorimetry and QC checks at validated wavelengths.
Tier 2 — Mid precision: single beam, 2 nm
| Model | Range | SBW | Accuracy | Repeatability | Notes |
|---|---|---|---|---|---|
| BRT-1800UV | 190–1100 nm | 2 nm | ±0.5 nm | ≤0.2 nm | 128×64 LCD; 100 curves + 200 data sets |
| BRT-5000UV | 200–1000 nm | 4 nm | ±2 nm | ≤1 nm | C-T monochromator; 4.3″ colour touchscreen; 10.5 kg |
| BRT-5200UV | 190–1100 nm | 2 nm | ±1 nm | ≤0.5 nm | C-T monochromator with real-time baseline monitoring |
Tier 2 is where BRT-1800UV becomes the accuracy leader in the single-beam line: ±0.5 nm wavelength accuracy and ≤0.2 nm repeatability rival several double-beam instruments at a fraction of the cost. The C-T monochromator models add the touchscreen workflow and real-time baseline monitoring for labs that need visual confidence in the baseline without stepping up to dual-beam optics.
Tier 3 — High-precision double beam, 1.8 nm
| Model | Range | SBW | Accuracy | Repeatability | Distinguishing feature |
|---|---|---|---|---|---|
| BRT-3200UV | 190–1100 nm | 1.8 nm | ±0.3 nm | ≤0.1 nm | Bilingual LCD; large on-board storage + 8 GB USB |
| BRT-5400UV | 190–1100 nm | 1.8 nm | ±0.5 nm | ≤0.5 nm | Split double beam + C-T monochromator; automatic 8-cell changer |
| BRT-5600UV | 190–1100 nm | 1.8 nm | ±0.3 nm | ≤0.2 nm | Low drift: stray light ≤0.05 %T, baseline drift ≤0.001 Abs/30 min |
| BRT-5800UV | 190–1100 nm | 1.8 nm | ±0.3 nm | 0.2 nm | Extended −0.301 to 4.000 Abs range |
| BRT-6100UV | 190–1100 nm | 1.8 nm | ±0.3 nm | ≤0.1 nm | Digital; 5″ graphic LCD; GLP software; 8 GB USB |
Selection logic inside Tier 3:
- Highest throughput → BRT-5400UV or BRT-5600UV, both with automatic 8-cell changers for continuous batch sampling.
- Lowest drift → BRT-5600UV, the only model in the range that publishes both ≤0.05 %T stray light and ≤0.001 Abs/30 min baseline drift.
- High-absorbance samples → BRT-5800UV, the only 1.8 nm model extending to 4.000 Abs.
- Documentation-led purchase → BRT-6100UV, which ships with GLP software.
- Best accuracy-per-dollar in the dual-beam line → BRT-3200UV at ±0.3 nm / ≤0.1 nm for the lowest weight in the tier.
Tier 4 — Research grade: 1.0 nm with PMT detection
| Model | Range | SBW | Accuracy | Repeatability | Stray light | Weight |
|---|---|---|---|---|---|---|
| BRT-5900UV | 190–900 nm | 1.0 nm | ±0.3 nm | 0.1 nm | ≤0.015 %T | 30 kg |
The BRT-5900UV is the range’s reference instrument: a 1600 lines·mm⁻¹ holographic grating, a photomultiplier tube detector, ±4.000 Abs range, stray light ≤0.015 %T and baseline flatness ≤±0.001 Abs. Note the deliberate trade-off — its wavelength range stops at 900 nm in exchange for 1.0 nm bandwidth and 0.05 nm resolution. It is built for sharp-band spectrophotometry and trace-level work, not for wide visible-range screening.
Visible-only line: 4 models, 325–1100 nm
| Model | Range | SBW | Accuracy | Display | Weight |
|---|---|---|---|---|---|
| BRT-1150V | 325–1050 nm | 4 nm | ±1.5 nm | 3.5″ TFT colour (480×320) | 8 kg |
| BRT-1200V | 325–1000 nm | 4 nm | ±2 nm | LCD | 10 kg |
| BRT-1800V | 325–1100 nm | 2 nm | ±0.5 nm | 128×64 LCD | 12 kg |
| BRT-5200V | 325–1100 nm | 2 nm | ±1 nm | 4.3″ colour touchscreen | 15 kg |
If your methods never go below 325 nm, this line delivers the same 2 nm accuracy as the UV/Vis tiers at a lower price and a lighter bench footprint — the BRT-1150V is the lightest instrument in the entire UV/Vis family at 8 kg.
→ Browse the full UV/Vis spectrophotometer category
Accessories and Hidden Costs to Budget For
The instrument is rarely the whole purchase. Plan for these line items before comparing quotations.
Cuvettes. Quartz cells are required below roughly 340 nm — glass and polystyrene absorb in the UV and will silently destroy your readings. Buy matched pairs, and treat path-length tolerance as a specification: Ph. Eur. 10th Edition tightened it to ±0.5 %, which is achievable for 10 mm cells but demanding for short-path cells. Fingerprints and scratches on the optical faces are a common, entirely avoidable error source.
Sample handling. Solid sample holders, film and plate holders, flow-through cells for HPLC detection, and micro-volume cells for DNA/RNA work are usually optional. Specify them at the point of order.
Automation. The automatic 8-cell changer in the BRT-5400UV and BRT-5600UV is built in; elsewhere it is an accessory. If you run dissolution profiles or large batches, price the automation against the labour it replaces.
Certified reference materials. Operational and periodic performance qualification need holmium oxide or holmium perchlorate for wavelength, potassium dichromate for absorbance, and cut-off solutions for stray light. NIST SRM 2034 — 4 % holmium oxide in 10 % perchloric acid in a sealed fused-silica cell, certified for 14 bands from 240 to 650 nm — is the most commonly specified reference material. Treat a complete CRM set as a recurring consumables budget line, not a one-off.
Lamps, software and documentation. The deuterium lamp has a finite life — get rated hours and replacement price in writing, and specify socketed lamp designs if uptime matters. GLP/GMP packages, audit-trail licences, printers and IQ/OQ documentation are often quoted separately, so request them in the same quotation to keep totals comparable.
Seven Common Buying Mistakes
- Buying on wavelength range alone. Range tells you what you can reach, not how accurately you can measure it. Bandwidth, stray light and drift determine data quality.
- Ignoring stray light. It is invisible on most datasheets and it silently caps the usable absorbance range. If a supplier will not state a stray-light figure, that is itself information.
- Assuming 4 nm bandwidth is always enough. Fine for COD; insufficient for sharp maxima and overlapping spectral features.
- Choosing single beam for kinetics or long scans. The drift error compounds over time. Shimadzu’s 40 %T → 36 %T example is a 10 % relative error from lamp decay alone.
- Forgetting the compliance requirement. If your data goes into a regulated submission, software and documentation requirements (audit trails, electronic signatures, ICH Q2(R2)-aligned validation) must be specified up front — they generally cannot be retrofitted.
- Under-budgeting cuvettes, CRMs and lamps. These are the items that turn a cheap instrument into a false economy.
- Buying UV/Vis to solve an FTIR problem. UV/Vis quantifies concentration and electronic transitions; FTIR identifies functional groups and molecular structure. Additive identification and polymer fingerprinting belong on an FTIR spectrometer.
How to Verify a UV/Vis Spectrophotometer Before You Buy
Ask the supplier to run these checks on the actual unit using certified reference materials. This is the operational qualification set specified by USP <857> and Ph. Eur. 2.2.25:
| Parameter | Reference material | Acceptance criterion | Source |
|---|---|---|---|
| Wavelength accuracy | Holmium oxide / holmium perchlorate (240–650 nm); didymium (>650 nm); cerium (<240 nm) | USP: ±1 nm (200–400 nm), ±2 nm (400–900 nm); Ph. Eur.: ±1 nm UV, ±3 nm visible | USP <857>; Ph. Eur. 2.2.25 |
| Wavelength precision | Same CRM, ≥6 replicates | SD ≤0.5 nm | USP <857> |
| Absorbance accuracy | Potassium dichromate in dilute sulfuric acid; neutral-density glass filters | ±0.010 AU (≤1 AU); ±1.0 % (>1 AU); Ph. Eur.: ±0.01 | USP <857>; Ph. Eur. 2.2.25 |
| Absorbance precision | Same CRM, ≥6 replicates | SD ≤0.005 AU (≤1 AU) | USP <857> |
| Stray light | KCl (198 nm), NaI/KI (220 nm), acetone (300 nm), NaNO₂ (340 nm) | Per USP <857> Procedure A or B |
USP <857> |
| Resolution | Toluene in hexane fine structure | Per USP <857> |
USP <857> |
| Baseline drift | Air blank, timed run | Compare against the datasheet figure | Datasheet |
Six questions to put in writing to every supplier:
- Will you provide IQ/OQ/PQ documentation aligned to USP
<857>and Ph. Eur. 2.2.25? - What are the certified traceability routes for your calibration standards — NIST SRM 2034 or equivalent?
- What is the rated life of the deuterium and tungsten-halogen lamps, and what do replacements cost?
- Does your software support audit trails, user access levels and electronic signatures for regulated environments?
- What is the recommended warm-up time, and what baseline drift should I expect across a one-hour run?
- What are your spare-parts lead times and local service response times?
Note that USP <857> was revised with effect from December 2022: photometric linearity was removed as a separate operational-qualification requirement, absorbance control was redefined around six replicate measurements at the upper and lower ends of the operational range, and certified reference materials are now preferred over laboratory-prepared solutions. Instruments whose documentation still references the pre-2022 checklist should be re-checked against the current chapter.
Frequently Asked Questions
Is a single-beam or double-beam UV/Vis spectrophotometer better? Neither is universally better — they suit different workloads. Single-beam instruments are better where cost, simplicity and bench space matter and measurements are made at fixed validated wavelengths over short sessions. Double-beam instruments are better wherever accuracy must hold over time: spectral scanning, kinetics, long unattended runs, high-throughput batch work, and any regulated environment. The optical difference is that double-beam optics measure sample and reference simultaneously and cancel lamp drift, while single-beam instruments measure them sequentially and inherit that drift as error.
What spectral bandwidth do I actually need? Choose 4 nm for fixed-wavelength colorimetric methods with broad absorption peaks, such as COD or ammonia. Choose 2 nm as the general-purpose standard — USP notes 2 nm is sufficient for most quantitative work. Choose 1.8 nm on double-beam instruments, and ≤1.0 nm only when you must resolve sharp or closely overlapping bands. Remember that measured peak positions shift at wider bandwidths, so 4 nm instruments are unsuited to spectral identification.
How do I know whether an instrument meets USP <857> or Ph. Eur. 2.2.25? Ask for wavelength accuracy of ±1 nm in the UV and ±2 nm in the visible range, wavelength precision SD ≤0.5 nm, absorbance accuracy of ±0.010 AU below 1 AU, and stray light verified with cut-off solutions. Then confirm the supplier will provide operational qualification documentation and certified reference materials to those criteria. Meeting the numbers on a datasheet is not the same as being able to demonstrate them during an audit.
Can a single-beam spectrophotometer perform spectral scanning? Yes — most single-beam models include scan functions, and bands will look correct if the instrument is properly warmed up and baselined immediately before the scan. The limitation is drift, not capability: over a long scan or a sequence of scans, the baseline will move and the spectrum will tilt. For routine scanning a double-beam instrument produces a smoother, more reproducible spectrum without manual baseline correction.
Do I need a UV model, or is a visible-only spectrophotometer enough? It depends entirely on your shortest wavelength. If every method you run stays above 325 nm — COD, ammonia, phosphate, most food colour and metal colour reactions — a visible-only instrument is the economical and space-efficient choice. If you measure nucleic acids at 260 nm, proteins at 280 nm, nitrate in the near-UV, or pharmaceutical assays, you need a UV-capable instrument reaching at least 190 nm.
What wavelength accuracy should I insist on? ±0.3 nm if you perform identification, spectral comparison, or transfer methods between instruments or sites. ±1 to ±2 nm is acceptable for routine fixed-wavelength quantitative assays where the calibration curve is built on the same instrument. Ph. Eur. 2.2.25 tolerates ±1 nm in the UV and ±3 nm in the visible range; USP <857> requires ±1 nm from 200–400 nm and ±2 nm from 400–900 nm. Where the two differ, the stricter one governs your market.
What is stray light and why should I care? Stray light is radiation reaching the detector from outside the selected bandwidth. It is the main reason spectrophotometers deviate from the Beer–Lambert law at high absorbance, producing readings that look plausible but understate concentration. It matters most at the edges of your operational range, and it worsens as lamps and optical components age. For high-absorbance work, a ≤0.05 %T specification is a reasonable floor; research-grade instruments reach ≤0.015 %T.
How many cuvettes do I need, and does the type matter? Buy at least four matched quartz cells for UV work — two to dedicate to the blank, two for samples — plus spares. Type matters absolutely: glass and polystyrene cells absorb below roughly 340 nm and cannot be used for UV measurement. For visible-only methods, glass is fine and cheaper. If you run batches, choose an instrument with an automatic multi-cell changer instead of handling cells manually.
Conclusion: Start From the Application, Then Buy the Optics
A UV/Vis spectrophotometer buying guide comes down to one question asked early: does anything in my method change between the blank and the sample? If the answer is no — fixed wavelength, short session, stable lamp — a single-beam instrument with the right bandwidth and stray-light figure will serve you for a decade. If the answer is yes — scanning, kinetics, automation, regulated data — buy double-beam optics and stop paying for drift.
Use this sequence:
- Fix the shortest wavelength you must reach. That decides UV/Vis versus visible-only.
- Fix the bandwidth your method needs. 4 nm, 2 nm, or 1.8 nm.
- Fix the stray-light and drift figures your absorbance range demands.
- Then, and only then, compare single beam versus double beam on throughput, scan needs and compliance.
- Add automation, cuvettes, CRMs, lamps and software to the budget before you compare prices.
Ready to configure an instrument? Send us your method and sample type — the BRT Testing engineering team will map it to the right system from the 16-model range, or download the full UV/Vis specification comparison and match the numbers yourself.
Published by the BRT Testing engineering team — Shenyang Baoruitong Automation Equipment Co., Ltd. BRT Testing designs and manufactures fire and flame testing equipment, UV/Vis and FTIR spectrometers, and plastic pipe testing systems for laboratories worldwide. About BRT Testing